
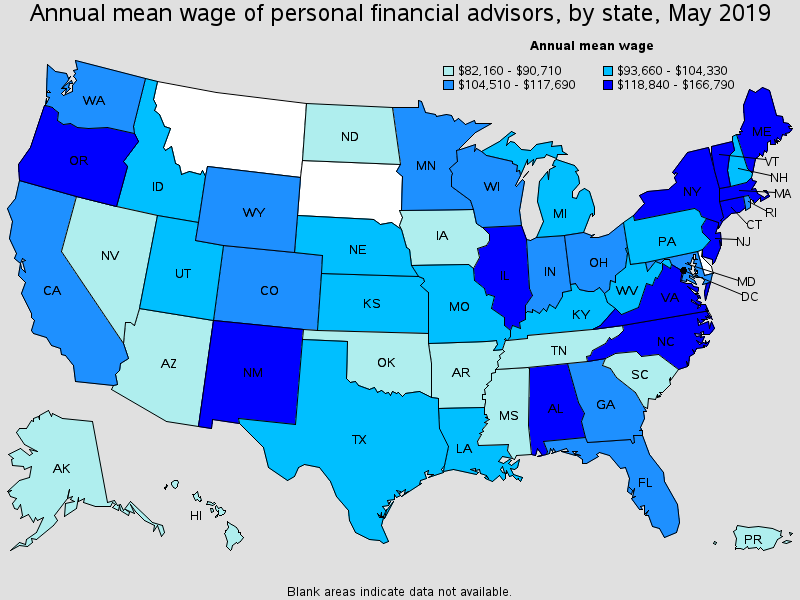
Turns out, where you live really does impact how much money you make as a financial advisor. While that shouldn’t be too much of a surprise to most, the difference between the top and bottom.
According to the Bureau of Labor Statistics most recent report, from May 2019, Advisors living in the state of New York are doing pretty well for themselves, raking in an average of $166,790 per year. Meanwhile, those in Hawaii make less than half of that, only pulling in $82,890.
Five Best States For Financial Advisors
|
State |
Employment |
Annual mean wage |
|
New York |
26,150 |
$166,790 |
|
District of Columbia |
810 |
$150,310 |
|
Illinois |
7,800 |
$142,440 |
|
Connecticut |
4,250 |
$137,440 |
|
Massachusetts |
7,960 |
$137,050 |
State By State: What Personal Advisors Earn
|
State |
Employment |
Annual mean wage |
|
Alabama |
1950 |
$118,950.00 |
|
Alaska |
110 |
$90,710.00 |
|
Arizona |
4050 |
$89,830.00 |
|
Arkansas |
910 |
$87,960.00 |
|
California |
25910 |
$117,690.00 |
|
Colorado |
4890 |
$113,570.00 |
|
Connecticut |
4250 |
$137,440.00 |
|
District of Columbia |
810 |
$150,310.00 |
|
Florida |
15830 |
$113,670.00 |
|
Georgia |
4950 |
$108,650.00 |
|
Hawaii |
640 |
$82,890.00 |
|
Idaho |
920 |
$99,220.00 |
|
Illinois |
7800 |
$142,440.00 |
|
Indiana |
4090 |
$115,010.00 |
|
Iowa |
1620 |
$86,480.00 |
|
Kansas |
2060 |
$102,660.00 |
|
Kentucky |
1800 |
$98,300.00 |
|
Louisiana |
1270 |
$102,150.00 |
|
Maine |
520 |
$135,660.00 |
|
Maryland |
4330 |
$104,510.00 |
|
Massachusetts |
7960 |
$137,050.00 |
|
Michigan |
5320 |
$100,380.00 |
|
Minnesota |
3900 |
$110,060.00 |
|
Mississippi |
700 |
$87,860.00 |
|
Missouri |
4440 |
$93,660.00 |
|
Montana |
410 |
- |
|
Nebraska |
1350 |
$97,260.00 |
|
Nevada |
990 |
$88,600.00 |
|
New Hampshire |
1060 |
$103,580.00 |
|
New Jersey |
4480 |
$120,880.00 |
|
New Mexico |
310 |
$124,790.00 |
|
New York |
26150 |
$166,790.00 |
|
North Carolina |
7690 |
$131,340.00 |
|
North Dakota |
370 |
$85,670.00 |
|
Ohio |
7040 |
$106,800.00 |
|
Oklahoma |
1270 |
$87,130.00 |
|
Oregon |
2090 |
$118,840.00 |
|
Pennsylvania |
9260 |
$104,330.00 |
|
Puerto Rico |
300 |
$82,160.00 |
|
Rhode Island |
- |
$109,030.00 |
|
South Carolina |
1930 |
$87,170.00 |
|
South Dakota |
310 |
- |
|
Tennessee |
2700 |
$84,420.00 |
|
Texas |
12800 |
$102,280.00 |
|
Utah |
2510 |
$98,180.00 |
|
Vermont |
360 |
$123,280.00 |
|
Virginia |
4500 |
$126,220.00 |
|
Washington |
3820 |
$111,890.00 |
|
West Virginia |
410 |
$95,780.00 |
|
Wisconsin |
5320 |
$108,610.00 |
|
Wyoming |
320 |
$116,560.00 |
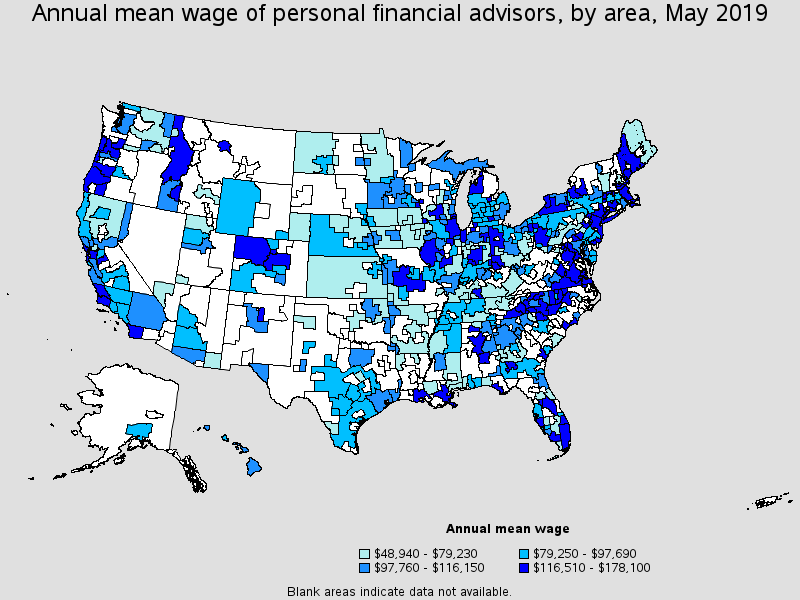
The Bureau of Labor Statistics breaks things down even further for the top makers in metropolitan areas. Somewhat surprisingly, Montgomery, Alabama is the top location for Personal Financial Advisors. While New York sits in fifth.
|
Metropolitan area |
Employment |
Annual mean wage |
|
190 |
$178,100 |
|
|
100 |
$173,970 |
|
|
110 |
$171,370 |
|
|
760 |
$168,760 |
|
|
26,900 |
$165,830 |
|
|
7,100 |
$157,720 |
|
|
50 |
$154,700 |
|
|
570 |
$154,490 |
|
|
280 |
$154,180 |
|
|
30 |
$153,180 |

