(Bloomberg) - As the Nasdaq 100 comes off its worst week since the pandemic selloff in March 2020, investors now have to contend with Wednesday’s Fed meeting, where officials are expected to signal that they’ll raise interest rates in March and shrink their balance sheet soon after.
U.S. Stocks Historically Deliver Strong Gains in Fed Hike Cycles
Here’s a look at how the U.S. stock market has fared historically when the Fed begins tightening rates.
Historical Strength
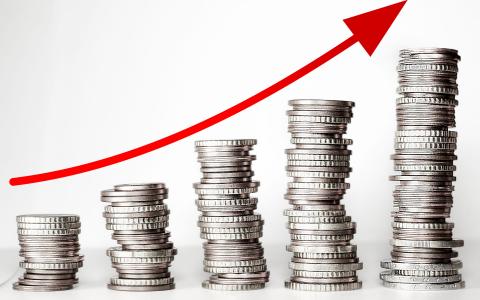
History indicates that 2022 is likely to end on a better foot than it started. U.S. stocks have historically performed well during periods when the Fed raised rates, as a growing economy tends to support corporate profit growth and the stock market. In fact, stocks have risen at an average annualized rate of 9% during the 12 Fed rate hike cycles since the 1950s and delivered positive returns in 11 of those instances, according to Keith Lerner, Truist’s co-chief investment officer. The one exception was during the 1972-1974 period, which coincided with the 1973-1975 recession.
Analysts don’t think lingering concerns about tighter monetary policy or the spread of Covid-19 will prevent the broader market from notching another positive year. On average, strategists project that the S&P 500 will finish 2022 at 4,982, 13% above Friday’s closing level, according to data complied by Bloomberg. The index surged nearly 27% in 2021 -- its third straight year of double-digit returns.
Read More: Where’s That ‘Fed Put’? Scorched Dip Buyers Confront New Reality
Historically, it has been beneficial for investors to maintain a cyclical bias leading up to the first rate increase, but the performance in the three months following that has struggled, according to Strategas Securities. There have been four distinct periods of rate-hike cycles by the Fed in the past three decades. The S&P 500 Materials Index, for instance, averaged a gain of 9.3% three months before the first rate hike in those four cycles, but then slipped by 2% three months after.
Although S&P 500 performance is often strong during a cycle of rate hikes, the unusually mild pullbacks experienced by the benchmark in 2021 could leave to bigger retreats this year.
Instead of the mild pullbacks of 5% or less that prevailed in 2021, history shows the potential for bigger retreats that sometimes ranged into double digits, according to Truist. Following the ten years with the shallowest pullbacks going back to 1955, stocks tended to rise the next year but were more volatile. The S&P 500’s deepest intra-year pullback averaged 13% while posting an average total return of 7%, Truist data show.
Another factor that could hit stocks this year is the U.S. midterm election in November. Market returns tend to be muted until later in the year, as there is less certainty of the outcome and the subsequent effects on policy changes.
Since 1950, the S&P 500 has averaged an intra-year pullback of 17.1% in midterm years, according to LPL Financial. But the final three months of a midterm year and the first two quarters of the following year, known as the pre-election year, have been some of the strongest quarters for stocks over the four-year U.S. presidential cycle. In pre-election years going back to 1950, the benchmark index has notched an average return of 32.3%.
By Jessica Menton


