As we all know, Treasury bonds are not a good idea for clients who want income that keeps up with inflation . . . at least until the Fed changes course. That's a challenge for nearly all advisors.
Rareview recently published a position paper that might help. If you like the ideas, you can get more like this by reaching out via the VIP Messenger.
-----
Interest rates are at the Effective Lower Bound (ELB). The Federal Reserve is attempting to engineer inflation. Traditional core bond portfolios are yielding less than 1.00%. Income seekers are acutely aware of the predicament they are in – that is, traditional fixed income products will most likely not deliver the real-world outcomes investors seek.
With the wide-spread acknowledgment that investors must move beyond traditional bond asset classes to achieve their income needs, the question often asked is: How much more volatility are you willing to accept in exchange for higher levels of yield?
We believe the answer to that question must be quantitative. Also, these three critical factors must be taken into consideration.
- Do you look back 3 years (i.e., intermediate-term) or 10 years (i.e., long-term), or both?
- Do you use daily, weekly, or monthly volatility, or a combination?
- Can you create a “like-for-like” yield comparison across asset classes?
To best represent our findings, we introduce two methodologies. The first one is potentially suitable for tactical/dynamic asset allocators. The second one is designed for long-term holders of assets.
Our primary conclusion is that non-traditional products deliver a high-quality yield for the additional risk that is taken. Moreover, we demonstrate that investors may achieve substantially more yield with diversification benefits than the high yield asset class without taking significantly more risk.
Methodology 1 – Yield-to-Risk Ratio
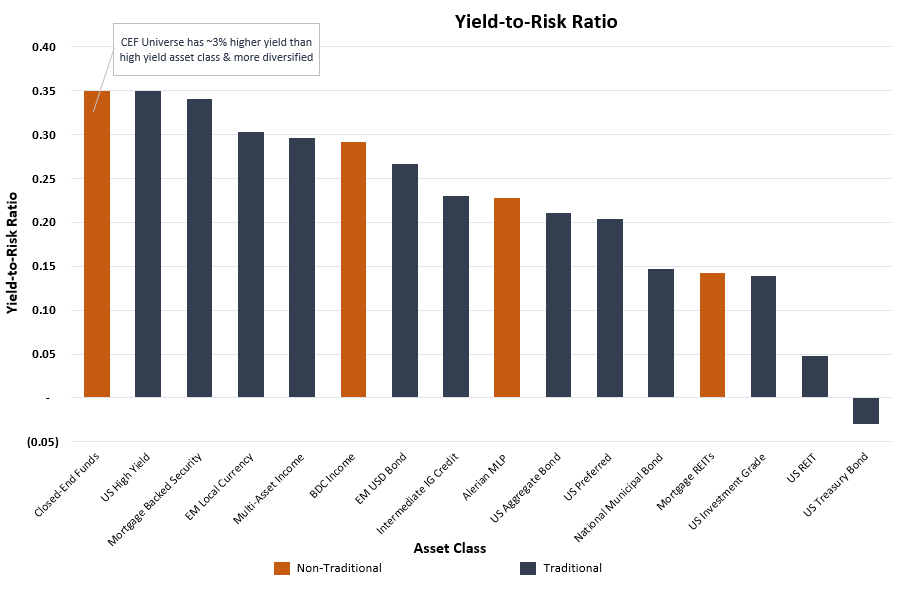
We define the yield-to-risk ratio as the current yield of an asset class minus the 10-year US Treasury yield divided by three-year annualized volatility, based on daily observations.
Firstly, by removing the risk-free portion of the yield and focusing solely on the yield’s credit component, the output is the current yield per unit of risk.
Secondly, we look back for three years using daily observations. The output, therefore, incorporates the current pandemic and the 2018 Federal Reserve interest rate hiking cycle. Said differently, short-term drawdown risk plays a greater role in determining the ratio.
This formula generates a “like-for-like” yield comparison across asset classes on an intermediate-term basis with different levels of volatility.
This methodology is optimal for tactical or dynamic asset allocators as drawdown risk on an intermediate-term horizon is important.
The below table shows the yield-to-risk ratio of various income-oriented asset classes. The orange bars depict non-traditional, and the blue bars illustrate traditional asset classes.


Methodology 2 – Risk-Adjusted Yield (RAY)
Risk-adjusted Yield (RAY) is measured by the yield per unit of risk, where risk is defined as the standard deviation of monthly total returns over the last 10 years divided by the 12-month trailing yield.
Firstly, analyzing a trailing yield relative to historical volatility helps calculate the income generated per unit of risk on a smoothing basis. The higher the ratio, the better RAY being offered by that asset class.
Secondly, by looking back 10 years using monthly observations, we eliminate recency bias, including the pandemic in 2020 and the Federal Reserve hiking cycle in 2018.
This methodology is prudent for long-term income seekers or those looking for cash flow enhancers over market cycles. Short-term drawdown risk is less of a consideration, as is separating the risk-free versus the credit component of the yield like in the previous methodology. After all, over long periods, total return and yield strategies converge since, in the long-term, 99+% of total return is due to yield.
The table below illustrates the RAY of various income-oriented asset classes. (see far right column)


Conclusion
The yield-to-risk ratio and risk-adjusted yield are important metrics when analyzing the level of risk taken to achieve a yield. When marrying both methodologies, we find the following observations relevant:
- Methodology 1 highlights that closed-end funds and the high yield asset classes score the highest on an intermediate-term basis. That is, current yields are attractive on both an absolute basis and adjusted for their higher risk, relative to other yield-oriented asset classes.
- Methodology 2 demonstrates that the non-traditional advantages of closed-end funds provide more benefit than the high yield asset class over the long-term. That is, the closed-end fund universe yield is almost 3% higher and provides diversification benefits over a single asset class.
- Relying on US Treasury bonds to add income or act as a ballast in a portfolio has an asymmetric reward-to-risk ratio to the downside because of the absolute low level of yields. In Methodology 1, US Treasuries were the only asset class to have a negative ratio, and Methodology 2 resulted in this asset class having the second-lowest RAY.


