

(Morningstar) Consider this for a moment: Warren Buffett is widely regarded as the greatest investor of all time for his outstanding 20.0% per year returns over an illustrious 55 years with Berkshire Hathaway. Yet even the "average" investor has been able to compete with Buffett in the last five years, with returns of 17.4% per year for the S&P500 (and 46.0% in the last year alone).1 New and amateur investors alike can therefore be excused for thinking they have near-legendary status when investing in these times, seemingly propelled by unprecedented fiscal and monetary stimulus.
This wave of strong performance comes with consequences though, with the escalation of U.S. stock prices, barely interrupted by the 2020 recession, lifting the price/earnings ratio (P/E) to levels not seen since the 1990s bubble.
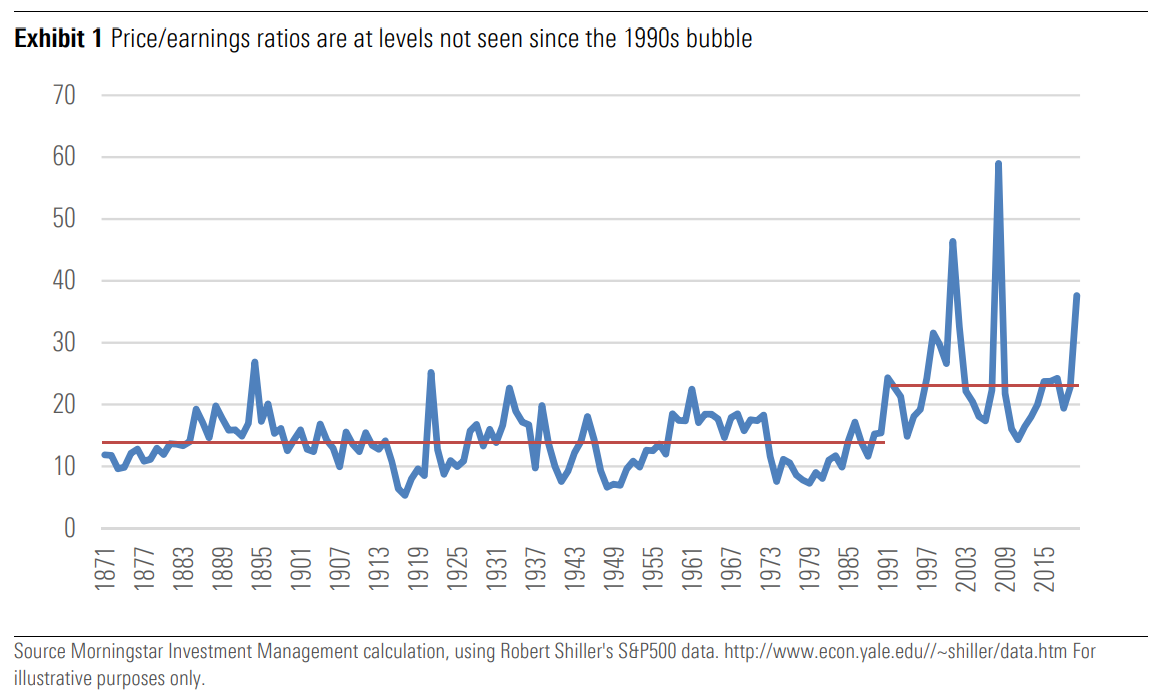
This has raised concerns that the U.S. stock market is overvalued and that we should expect very low returns in the medium run. In this note we take a fresh look at how likely it is that the market is overvalued— in other words, whether investors should expect lower returns over the next five to 10 years than the historical norm. While a lot of recent attention has been devoted to the impact of interest rates, here we focus on another key input into any valuation model: growth.
The Devil is in the Detail
One way to determine whether the market is overpriced is to assess a measure called the fair-value P/E. That represents the aggregate price of a market’s securities divided by the aggregate earnings of its companies. This ratio can help us understand the rate by which investors might expect returns in the medium term to be about equal with their long-term average.
But it’s not as simple as just calculating the fair-value P/E, because fair-value P/Es are like opinions: everybody has one. Well, maybe not everyone, but most professional investors have one. To calculate your fair-value P/E, you take the present value of your expected cash flow growth rates discounted at your required discount rate.
These measures are not facts, but estimates, which may clarify the debate over “overvaluation.” Assuming markets are rational, high P/E ratios correspond to either high expected cash flow growth or low required returns. Here, “expected” or “required” refer to the one making the fair-value P/E estimate, but also by the market as a whole—the former is a calculation, while the latter may be observed by current prices. In this way, the current P/E is a fact, so if we all agree on growth, then we agree on the discount rates implied by today’s P/E. A worthwhile discussion of overvaluation, then, cannot begin before we discuss growth.
What Is the Right Growth Rate?
Since equities are a claim on an infinite stream of cash flows, and growth expectations for the distant and near horizons might differ, we find it useful to split the horizon into the medium run and the long run. For this analysis, the long run starts five years from now—you can think of it as the year by which we assume growth reverts to an “equilibrium rate” or secular trend.
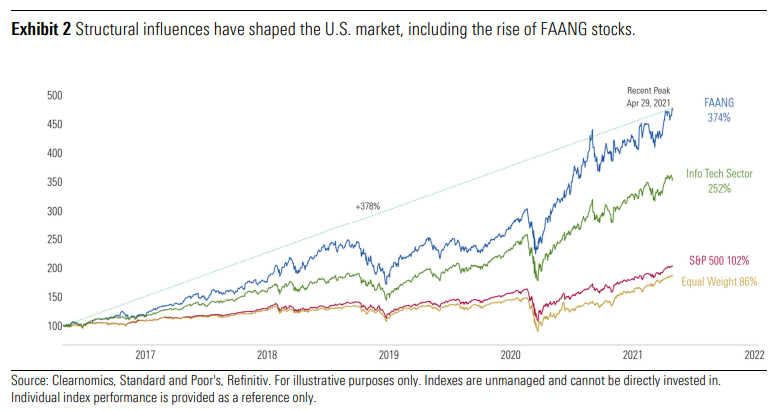
The debate on what long-run growth rate is reasonable has been affected by at least three recent phenomena. The first is the increasing importance of overseas profits for U.S. corporations. The second is the fact that profits—in aggregate—have grown faster than the overall U.S. economy for some time. Third, and more recently, a group of large and profitable technology firms, sometimes referred to as FAANG, has significantly outpaced the rest of the U.S. stock market. These, and possible other “secular” trends, raise the question of what growth rates are reasonable to expect for the long run. In this note we will remain relatively agnostic.
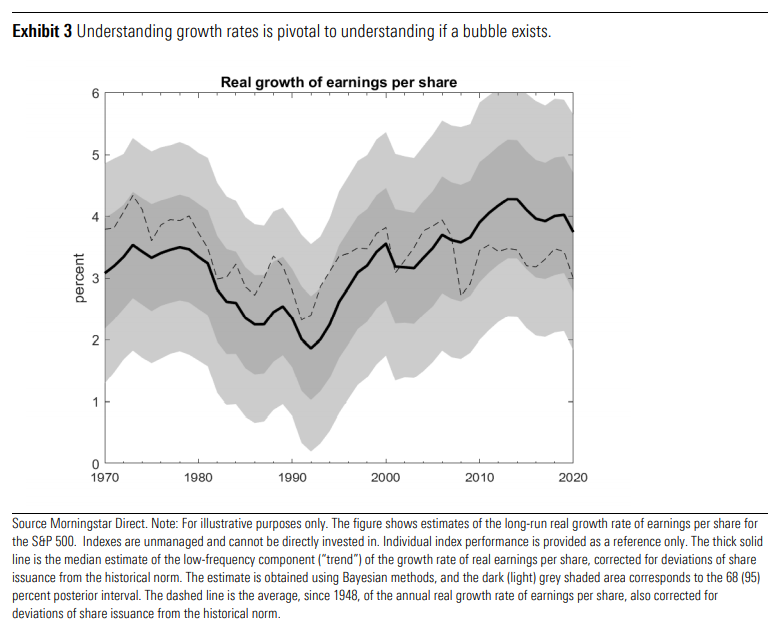
The key is to understand these influences when measuring long-run real growth and acknowledge that the future growth rate carries uncertainty. One useful way to capture this is via a long-term growth rate model. This is what we've outlined below. The first measure, represented by the continuous line and the shaded bands around it, comes from a sophisticated statistical model that extracts a slow-moving “trend” from past data. The second one is simply the geometric average of growth rates since 1948. Both are calculated using only information available in “real time,” so there is no look-ahead bias.
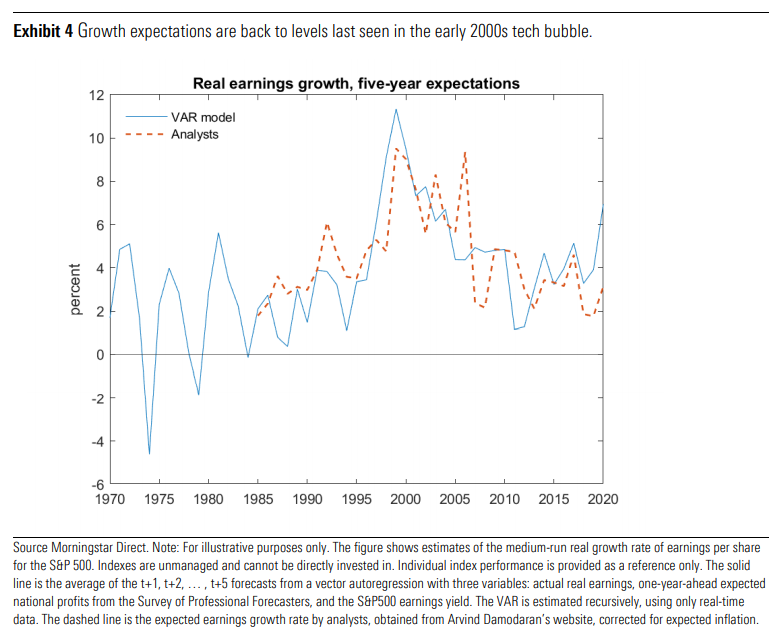
We can then use this backward-looking analysis to compare against two measures of medium-term expected real growth. This forward-looking model is shown below. The first one is from a statistical model that forecasts growth over a five-year horizon, again using real-time information only. The second measure is from a survey of analysts, which we have corrected for expected inflation. Since 1985, when the analysts’ series begins, analysts and the model have been in rough agreement, with isolated exceptions.
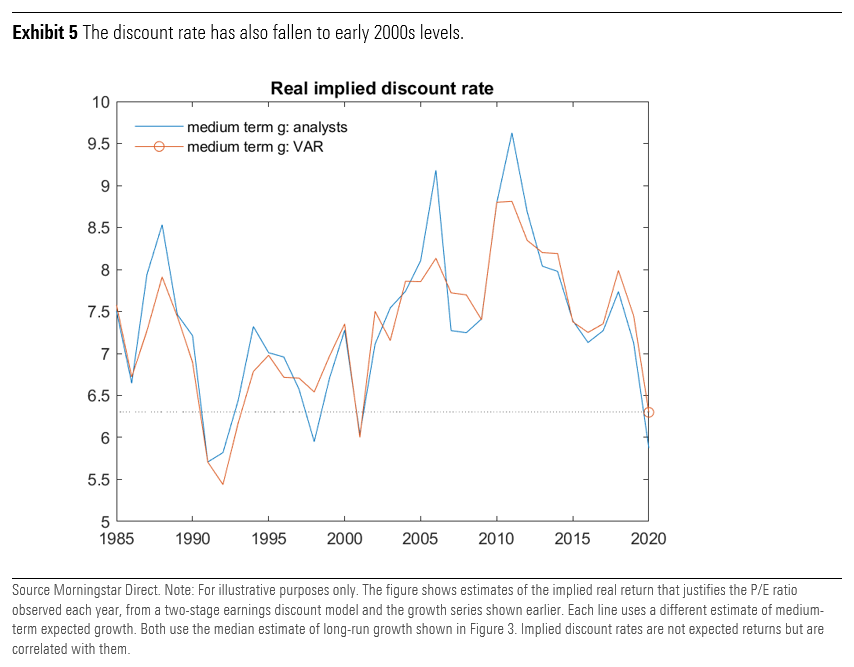
Ok, so we now have the key inputs. So, let’s plug those growth expectations into a two-stage present value equation, and calculate the implied return, given observed P/E ratios. Exhibit 5 shows such estimates since 1970, with two versions, one for each measure of medium-run growth expectations, and always using the median long-run growth rate shown in Exhibit 3. The implied rate of return in 2020 is between 5.9% and 6.3%, which is among the three lowest values in our series since 1985. This implied rate of return can be interpreted as the annual return the investor would realize if the index was bought at the end of 2020 and held forever. The range of estimates is wide, reflecting uncertainty about future growth, and leaving plenty of room for disagreement about the absolute level of future returns. Relative to history, however, we believe this estimation may provide us a clear message: expect lower-than-average returns.
This is a behind-the-scenes look at how we research market behavior. Note, this is less about forecasting and more about understanding the motives of market participants. It helps us determine fear and greed, guiding our perspectives on risk and return potential.
Now, the long-run real growth rate we used, for 2020, was 3.7%, and the medium-run rate was 3.2% or 6.9%, depending on the source. Some people may balk that those are too optimistic. Using lower growth assumptions, for example in the neighborhood of 3%, can only make the relative overvaluation case stronger, since lower growth must be matched by lower discount rates for the present-value valuation equation to hold. Conversely, if you want to claim that the implied discount rate is, say, near its average of 7.3%, then you must defend that real earnings growth will be about 5% in the medium and long run.
Despite the fact that, in this note, we have assumed relatively generous growth going forward, P/E ratios are so high that we can’t escape the conclusion that we believe the market is priced to deliver very low returns. Although there is great uncertainty around the specific return that we should expect, the odds are that it will be lower than the average return we have seen in the past 10 to 20 years.

