
(Shroders) - Are commodities staging a comeback?
Commodities have come under greater scrutiny in recent months. Being one of the only winners in 2022, where most assets saw huge declines, investors have been asking if commodities should play a more strategic role in multi-asset portfolios.
The post-global financial crisis era saw an unprecedented period of loose monetary policy combined with low and steady inflation. That has since come to an end, and looking ahead, we’re expecting a more “typical” period of inflation.
From the chart below, we can see that the period from 1968 to 1994 is an environment where inflation was mostly above 3% (grey shaded area in Figure 1). If we are entering a new regime with higher and more persistent inflation, then the period between 1968 and 1994 could be a useful reference point.
Figure 1: Back to the 70s to mid-90s?

A mix of events caused elevated inflation in the 1970s; predominantly excessive fiscal expenditure in the late 1960s, cumulating in the end of fixing the US dollar against gold in 1971, followed by a Middle East embargo on oil exports to the US in 1973. Loose monetary policy, which was meant to generate jobs in the US, also caused the side effect of skyrocketing inflation.
There are many parallels between the recent bout of inflation in 2022 and the past, and we believe this period holds interesting insights for commodities in the new regime.
In this paper (available as a PDF here), we discuss how commodities can be included in a Strategic Asset Allocation (SAA) as we enter an environment not seen in over 30 years. While we are looking at commodities as a whole, we do not have a specific view on gold to be included in SAA as a separate asset class.
Investing in commodities in the new regime
The green energy transition will benefit commodities
Countries and companies are likely to rapidly accelerate the de-carbonisation of power generation as emissions need to fall in order to meet net zero targets (see Regime shift: the accelerating response to climate change). One direct impact will be on producers of green commodities1, which are materials that are basically identical to non-green ones but are produced through environmentally-friendly methods. Companies who want to improve energy efficiency throughout their supply chain (including ensuring materials they purchase were made using economically-friendly methods) will drive demand for such materials.
Currently, climate mitigation focus is driving underinvestment in base metals. We believe that once the green transition grows, the demand for batteries, base metals and even rare earth elements will rise as these are critical for clean energy generators. As the response to climate change accelerates, demand will follow accordingly, and this will be beneficial for commodities in the medium-term. According to a study done by McKinsey, the demand for green materials (such as the European low-carbon battery, European flat green steel and global automotive-grade recycled polypropylene) could exceed supply by 2030.
Geopolitical risks also complicate matters – the war in Ukraine surfaced questions surrounding energy security, especially in Europe. While this impedes energy transition in the short-term, countries that take net zero transition seriously will eventually converge and drive the green transition. Our economists’ conclusion that the European bloc is leading in terms of climate action and showing strong commitment in tackling global warming, reassures us that things are moving along the right path despite short-term disruptions.
Structurally higher and persistent inflation may be a win for commodities
We think that certain assets will benefit more than others as the global economy is likely to continue to face cyclical inflation, and learns to cope with higher structural inflation. From our analysis, commodities have historically displayed positive beta (or correlation) to inflation (Figure 2), with commodity prices moving somewhat in the similar direction as inflation. This makes sense as real assets with actual utility tend to fare better when inflation rises. From a beta perspective, investing in commodities grants the investor diversification, especially if one believes in a structurally higher inflation in the new regime. This brings us nicely to our next point: diversification.
Figure 2: Commodity returns usually positive when inflation moves higher

Commodities to boost portfolio diversification
Before adding a new asset class into an investor’s SAA, we need to consider if there are any improvements to the portfolio’s risk-adjusted returns. Investors need to consider the overall investment objectives and asset allocation constraints, which will include diversification or correlations to other asset classes. Commodities have definitely behaved more akin to equities than bonds, but how do correlations look?
Better diversification than bonds?
With equities being the primary driver of portfolio returns, it’s important for investors to have diversification away from equity volatility in a portfolio. That’s why for the past two decades, a 60/40 portfolio consisting of equities and bonds worked; bonds helped offset losses whenever equities underperformed. With the role of bonds in a portfolio being questioned after a horrendous 2022, investors are turning to other assets to act as diversifiers.
Using the inflationary periods of 1972 to mid 1994 for reasons explained above, our analysis suggests that commodities might just be able to do the trick. Figure 3 shows that in different inflationary environments, the relationship between assets will shift. In environments where inflation is greater than 3%, regardless of whether it’s rising or falling, equities have typically had more negative correlations with commodities compared to bonds.
Figure 3: Commodities can improve diversification in an equity-bond portfolio…

It is important to acknowledge that correlations fluctuate and are unstable, but also understand that it is not necessary for it to be negative in order to have a positive diversification impact on portfolios. While the numbers show that commodities tend to be better diversifiers compared to bonds, we look at the relative correlations in greater detail (Figure 4) and attempt to explain the phenomenon.
Figure 4: Equity and commodities correlations from 70s to 90s can be broken down into three phases

Through this inflationary chapter of history, equity/bonds have been consistently positively correlated. Digging a little deeper, we can divide this period into three distinct phases, as shown.
Phase 1 (1973-1980) was an environment where both equities and commodities experienced positive returns, which led to rising equity and commodity correlations. Central banks conducted double digit rate hikes to combat high inflation, and there was high unemployment in the labour market. Despite this, equity markets returned positively while commodities were supported due to the geopolitical risks which disrupted global oil supply and caused a spike in oil prices. Consequently, equities and commodities correlations started to rise during the late 70s.
Phase 2 (1980 – 1987) saw bonds depreciate as a casualty of rate hikes, causing the correlation with positively returning equities to also fall. Coupled with rising equity/commodity correlations, for a brief moment, bonds were the better option to reduce risk in portfolios. However, it has to be noted that despite being better diversifiers between 1980 to 1983, equity/bond correlations remained within historical ranges during those years and did not display overly surprising behaviours. In other words, the rise in commodity prices was the main reason why correlations flipped in support of bonds. Towards 1984, equity/commodity correlations subsequently peaked and slowly declined as commodities started seeing negative returns; rising supply of food and larger production capacity of agricultural raw materials and metals were some of the reasons why.
Phase 3 (1987 – 1994) saw restrictive monetary policy put in place earlier by central banks take its toll on the economy. The loss of consumer and business confidence was not a good sign for equities, which saw ~40% peak-to-trough losses at one point, while the 1990 oil price shock boosted commodities. The equity and commodities correlation turned more negative and this further led to the relative relationship between equities/commodities and equities/bonds to widen.
Our takeaway from this is that while there may be shifts in the underlying economic narrative, one theme that’s broadly consistent is that commodities have historically been the better diversifier compared to bonds during inflationary periods.
So how do we include commodities in strategic allocations?
Since the introduction of modern portfolio theory, portfolio constructors have always been concerned about maximising expected returns for a given and acceptable level of risk. Here, using our proprietary in-house modelling tool, we can see that for investors with lower risk tolerance (<6% p.a. volatility), allocating to commodities will offer diversification benefits that bumps expected returns upwards (Figure 5).
Figure 5: Comparing efficient frontiers: commodities offer diversification on the lower end of risk spectrum

As with all financial models, assumptions drive the output. In the first iteration, we used a 15-year lookback from 31 December 2008 for the correlation matrix (Figure 6) as that was the pre-QE era.

As we’ve mentioned earlier, we believe that in periods of heightened inflation, commodities should provide better diversification than bonds. The correlation matrix in Figure 6 directly contradicts this, as the lookback period conducted covered periods of low inflation. This is an important point - commodities have fallen out of favour in multi-asset portfolios as inflation hasn’t been a problem for over 15 years. If we accept that we are in a new regime where at the very least, inflation is once again a threat to investment returns, then the prior 15 years of persistent low inflation can be considered an anomaly, and a structural allocation to commodities can once again make sense.
To further support our theory, we split our historical window into periods where the market was experiencing greater fluctuations in inflation over growth, and vice versa, as a method to determine which of the two is driving the market. We then calculated the correlations for each scenario (Figure 7).
Figure 7: Commodities provide greater diversification when market focuses on inflation

We find that when the market is focused on inflation rather than growth, equity/commodity correlations are negative while equity/bond seem to be strongly correlated. With inflation coming back as a key threat, coupled with the Fed’s focus now firmly on bringing inflation back to the 2% target, the case for including commodities in portfolios grows stronger. What happens to our efficient frontiers if we update our correlation matrix (Figure 8) to reflect the findings in Figure 7?
Figure 8: Correlation matrix when market is focused on inflation

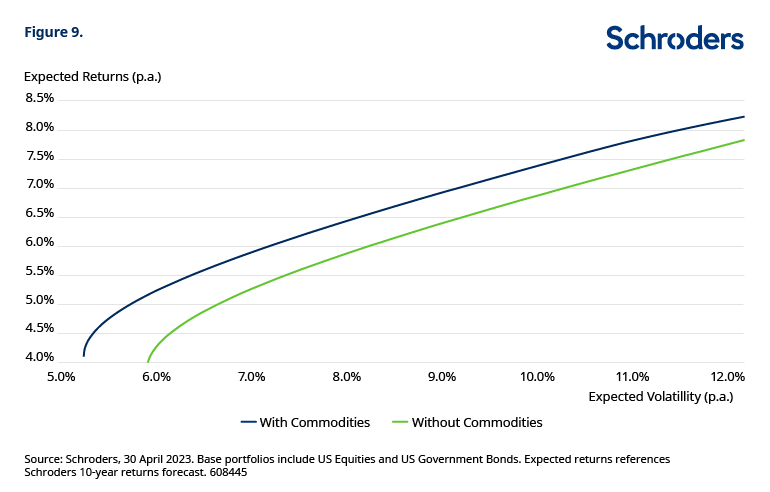
Keeping our return assumptions constant, the efficient frontiers using these correlations drastically change the results (Figure 9). For unconstrained portfolios with expected volatility of 10%, investors can expect a pick up of ~0.5% in expected returns.
Figure 9: Portfolios with commodities provide better expected risk-adjusted returns
For ease of comparison, we show in Figure 10 the asset allocations for the unconstrained portfolios given an expected volatility of 10%. For this amount of risk, our model has allocated the unconstrained portfolio 30% in commodities, 64% in equities and 6% in bonds for the most optimal risk-adjusted returns.
Figure 10: Allocation for an unconstrained portfolio with 10% expected volatility p.a.

Realistically, however, portfolios often have constraints and investors have to follow guidelines set out by clients. We’re also not looking to completely overhaul the traditional SAA – will adding a small allocation still help? Including another constraint to our modelling by limiting commodities to a maximum allocation of 10%, Figure 11 shows similar results.
Figure 11: Portfolios constrained to 10% commodities also provide better risk-adjusted returns

For this constrained portfolio with expected volatility of 10.0%, investors can expect a pick up of ~0.3% in expected returns. Based on our models, the constrained portfolio has an asset allocation of 26% in bonds, 64% in equities and 10% in commodities, as opposed to the original portfolio with 59% equities and 41% bonds (Figure 12). This phenomenon is due to the assumption of negative correlations between commodities and equities (Figure 8). The negative relationship allowed for a higher equity weight, an inclusion of commodities and lower fixed income weight, while maintaining the same level of expected volatility.
Figure 12: For a constrained portfolio with 10% expected volatility p.a.

Conclusion
Commodities have been irrelevant after almost 15 years of insignificance in the multi-asset portfolio construction process, as inflation remained well under control. More recent history in the past year shows that inflation can, and most probably will, be an issue. Our analysis shows that commodities are a better hedge than bonds in inflationary environments, and multi-asset investors should re-consider commodities as a strategic holding in portfolios. An arbitrary 10% allocation to commodities could provide a pickup of ~0.3% expected returns for portfolios with 10% expected volatility.
1Source: Cramer, D., Smeets, B., Van Hoey, M, Wiebes, E. The new imperative for green commodities, McKinsey & Company, August 2022.
By Oliver Taylor, CFA | Multi-Asset Fund Manager
Joven Lee | Multi-asset Strategist
May 16, 2023

