
President Trump has been in office for three years, which is enough time to analyze how the economy is doing vs. his statements on how it would perform. The U.S. Bureau of Economic Analysis released its first estimate for 2019’s fourth quarter GDP growth and for the full year. For the fourth quarter GDP growth came in at 2.1%, which was the same as the September quarter and for the full year it fell from 2.9% in 2018 to 2.3% last year.
It appears that the tax cuts that started in 2018 helped for one year but don’t have much of a carryover effect. The promise that they would pay for themselves has not materialized as the Federal budget deficit has ballooned to $1 trillion levels not seen in a non-recessionary environment.
The outlook for a slower economy caused the Fed to lower interest rates and increase its balance sheet, which led to the stock market’s rallying in 2019 even when corporate profits were essentially flat. While the Phase One trade deal has been signed with China, its outlook was murky even before the Wuhan coronavirus hit. Its goals looked to be overly ambitious and didn’t tackle the really tough items on the agenda.
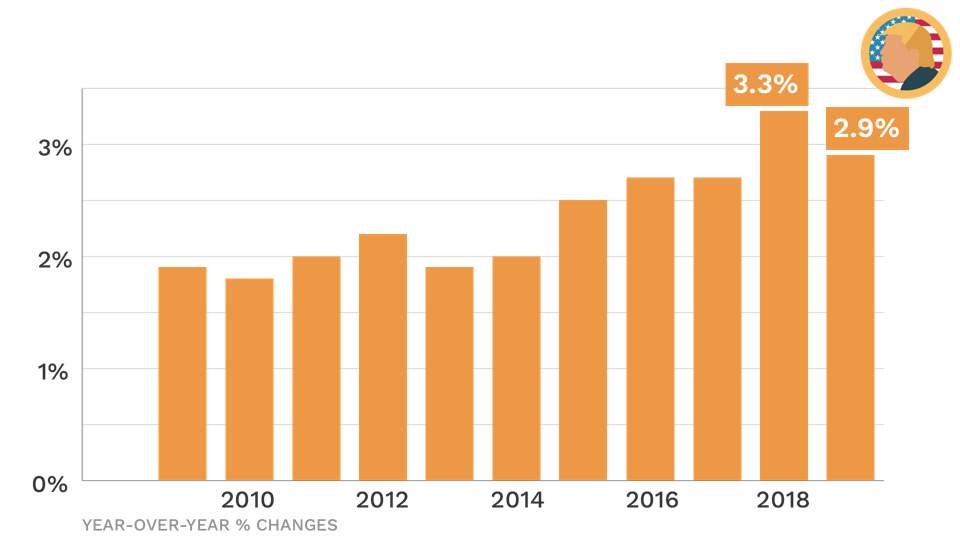
Yearly GDP growth
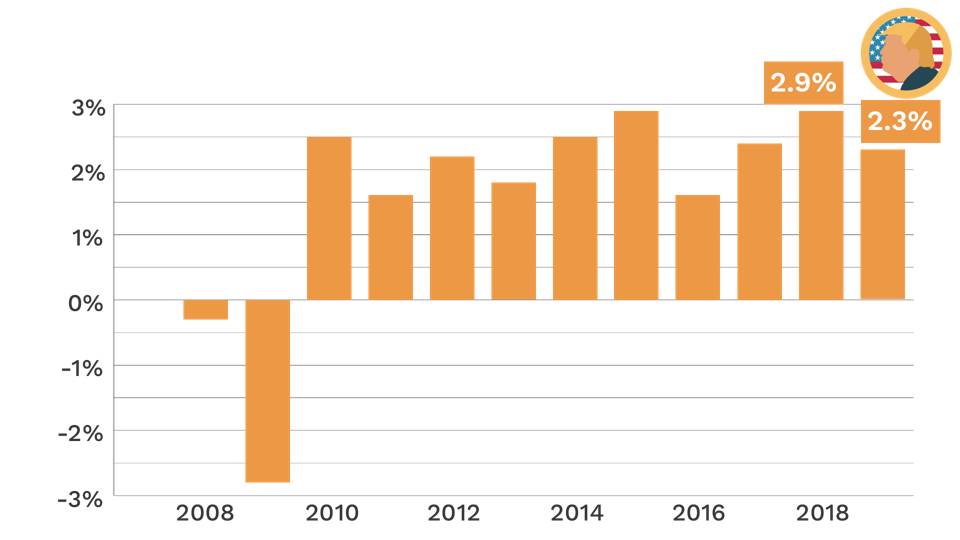
GDP growth hasn’t reached Trump’s 3% or higher goal
Trump didn’t do himself any favors with the trade wars he started and even the signing of the Phase One trade agreement with China looks like an overpromise and under-deliver deal given the goals that were agreed to. While GDP growth crossed over 3% in a few quarters the past three years, on a full year basis GDP growth hit a high point of 2.9% in 2018, the year that Trump’s tax cut took effect. With it falling back to 2.3% in 2019 it appears that tax cut was essentially a sugar rush for one year. This is a shortfall to Trump’s claim that the economy could grow 4%, 5% or maybe even 6% when he was President.
Unemployment rate
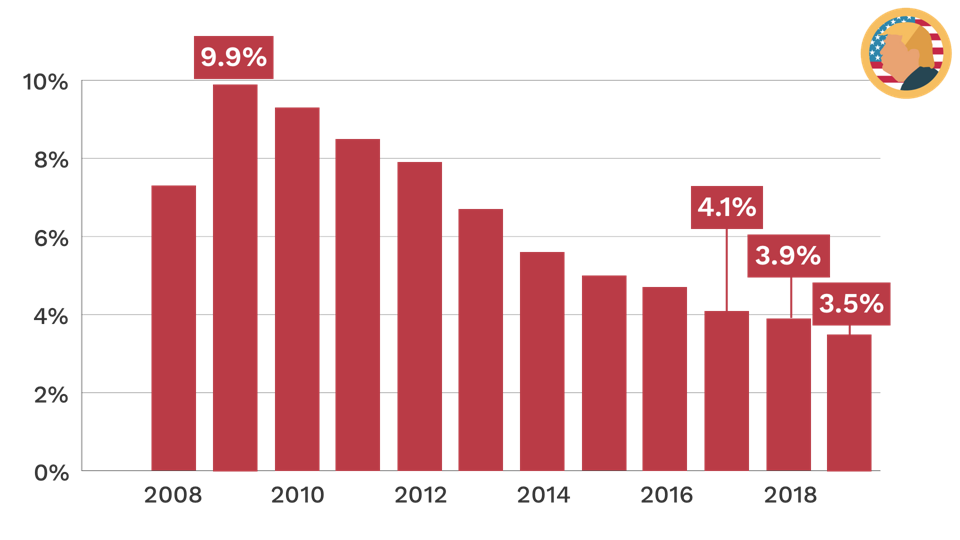
Unemployment rate is about as low as it can go
The unemployment rate has dropped steadily from its peak of 10% in late 2009. Over the past 10 years it has fallen to 3.6% and has been bounced between 3.5% and 3.7% over the past nine months. During Trump’s three years in office, it has fallen 1.2% and the decrease was essentially a continuation from the Great Recession’s recovery.
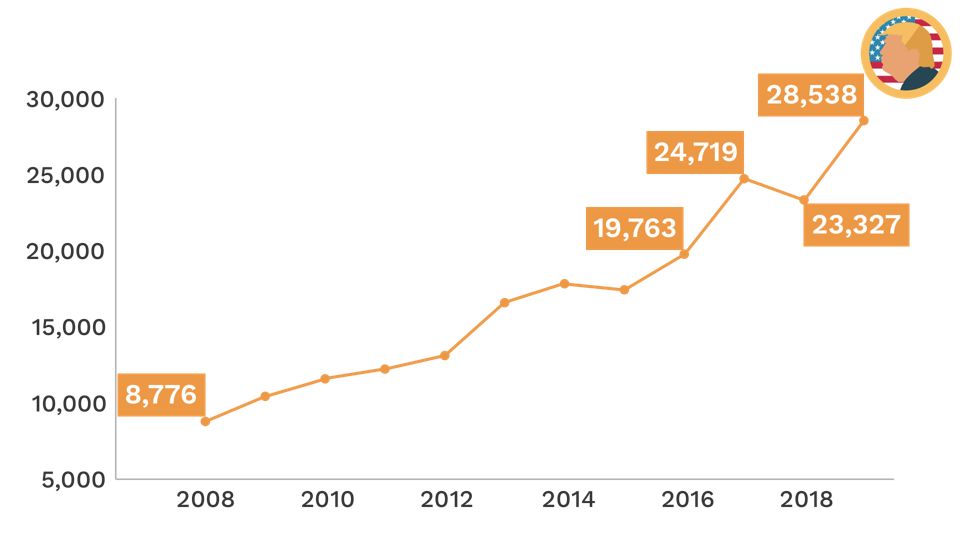
Yearly job growth
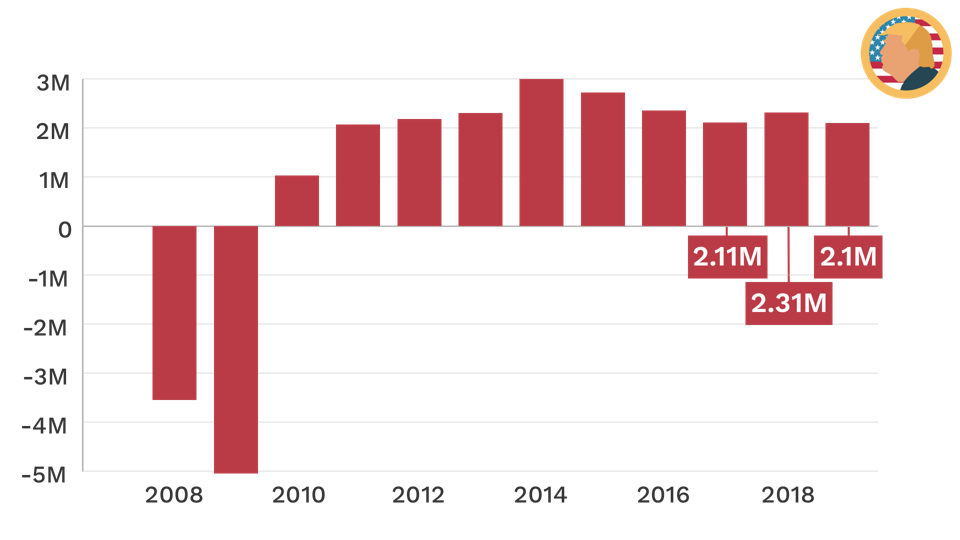
Job growth has plateaued
Except in 2018 when the tax cut seems to have helped the job market, job growth has been just over 2 million per year under Trump. It is more challenging to add jobs when employment is high, but Trump touted that 25 million jobs could be added over 10 years once he entered office, which looks like a stretch given the current hiring rate. Additionally, Obama added over 1.6 million more jobs in his last three years in office compared to Trump’s first three years.
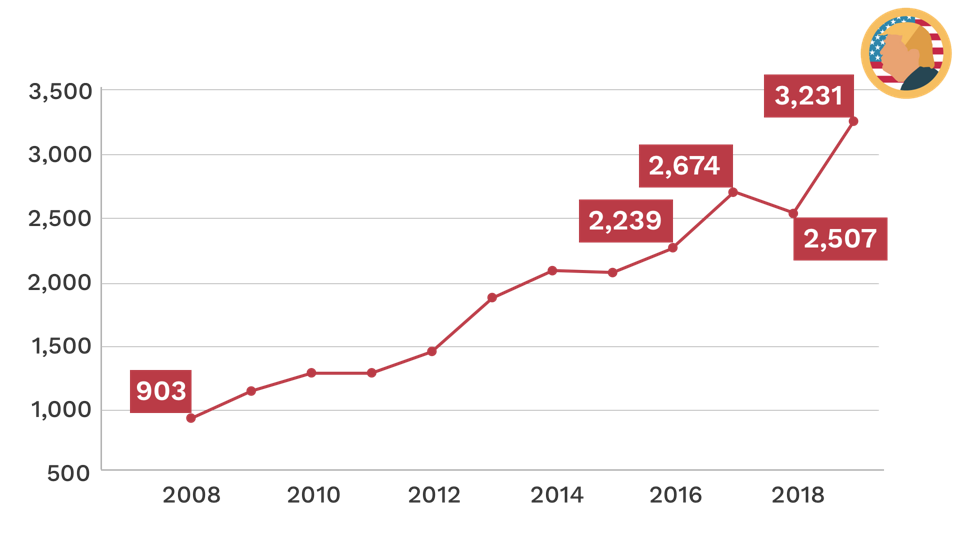
Manufacturing job growth
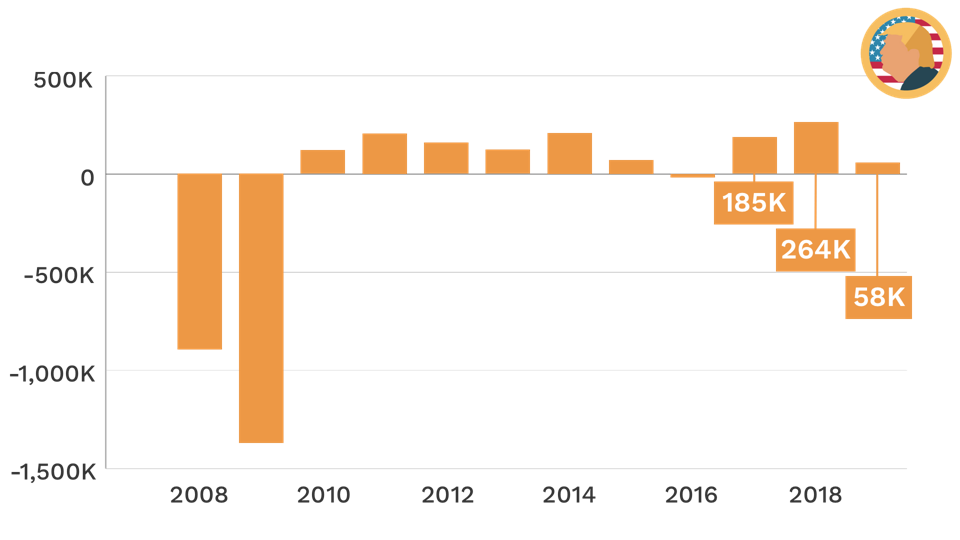
Manufacturing jobs hurt by the trade wars
Manufacturing jobs rebounded in Trump’s first two years in office, but their growth rate slowed dramatically in 2019. The decline is at least partially due to the trade wars impacting global growth and the U.S. economy experiencing slower growth last year.
Wage growth
Wage growth is better but seemingly stuck around 3%
Wage growth has taken a step up during Trump’s Presidency, but fell off a bit in 2019. Economists have expected wage growth to be stronger as the economy recovered from the Great Recession, but it seems to be stuck at around 3%.
Dow 30 Industrials
The Dow has risen over 10,000 points
The Dow 30 Industrials has risen over 10,000 points or just under 60% since Trump was elected. While this is positive for a portion of Americans, two major reasons the stock markets have risen the past three years is due to the tax cuts (but they are helping to balloon the federal budget deficit) and the Federal Reserve keeping interest rates low and flooding the markets with cash (due to concerns about the economy’s growth rate). These have led to valuation multiples increasing while company profits were flat last year.
S&P 500
The S&P 500 has also benefited from the Fed
The S&P 500 has risen just a bit less in percentage terms than the Dow. The gains are largely driven for the same reasons as the Dow, but one interesting aspect is that the $1 trillion market cap companies (Apple, Microsoft, Amazon, and Alphabet/Google) have had an outsized influence on the index. Just like the Dow, the Fed lowering interest rates and flooding the economy with cash has led to higher valuation levels while company profits were stagnant last year. The markets will need earnings growth to rise significantly this year.
U.S. Federal budget deficit
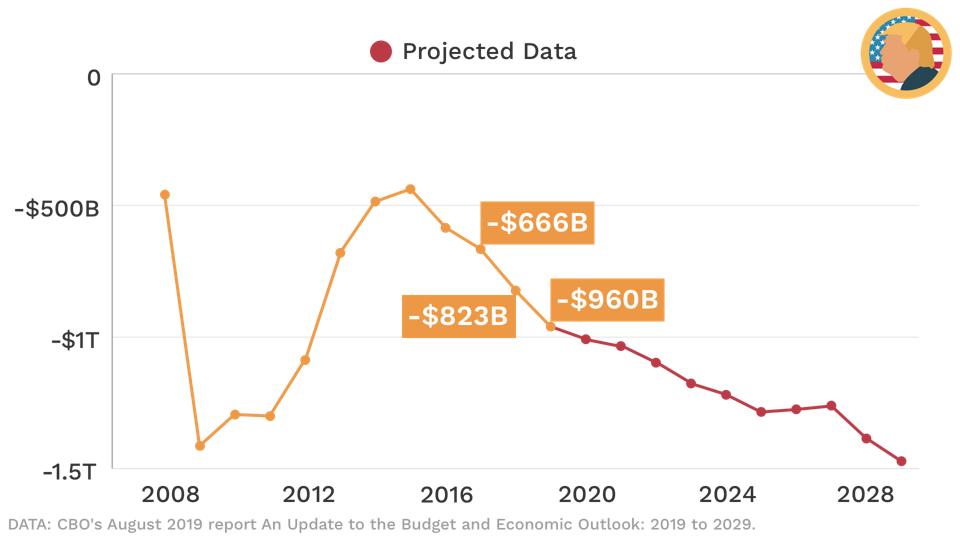
Federal budget deficit ballooning above $1 trillion
The Federal budget deficit has increased over 68% in Trump’s three years in office and is expected to exceed $1 trillion in 2020 and beyond. This is in direct contrast to his statements that it would be easy to eliminate not just the deficit but also the Federal debt.
At $1 trillion it will be the largest budget deficit in history, except when there is a recession, and even without another downturn it is projected to be over $1.7 trillion in 2030. If, and more likely when, there is another recession the deficit could easily top $2 trillion.
U.S. trade deficit
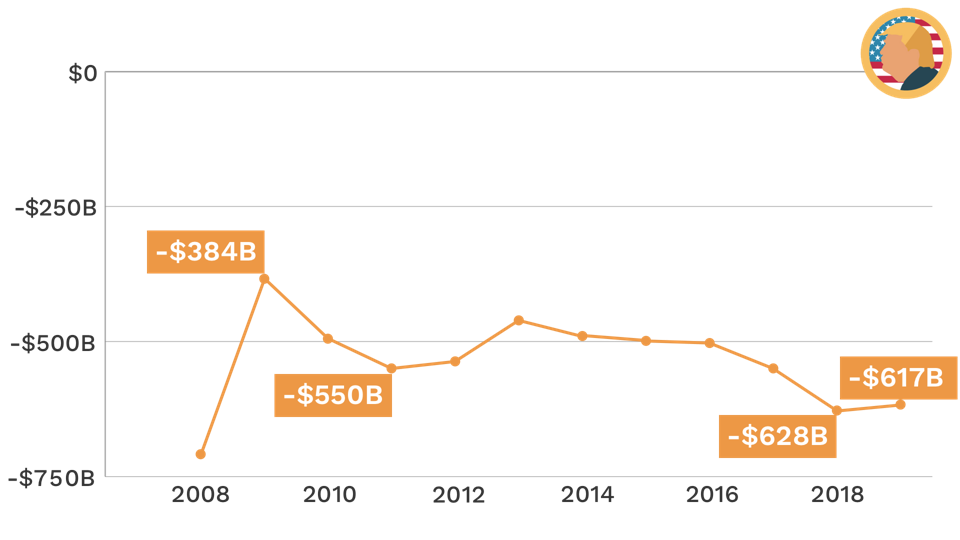
Trade deficit has grown despite the trade wars
During Obama’s eight years in office the trade deficit ranged from $384 billion in 2009 due to the Great Recession to $550 billion in 2011 as the U.S. economy recovered earlier than the rest of the world. Under Trump the trade deficit has grown to over $600 billion the past two years despite trying to decrease it via the trade wars he has started.
U.S. Goods exports to China
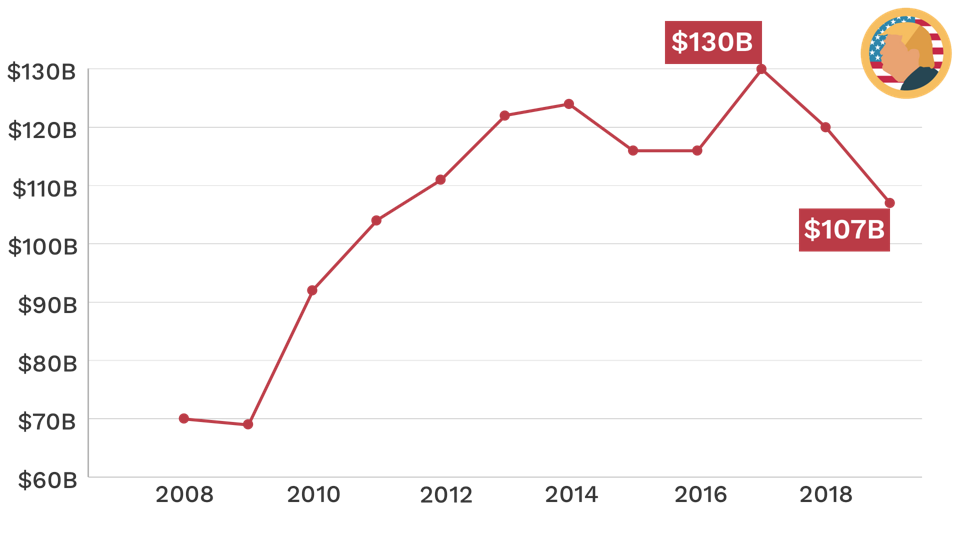
U.S. goods exports to China have fallen, hurting companies and farmers
After Canada and Mexico, China is the third largest buyer of U.S. goods. A result of Trump’s trade war with China is U.S. companies and farmers selling fewer goods to it. After peaking in 2017 at $130 billion, goods exports to China have fallen $23 billion or 18% to $107 billion in 2019. One group that has been especially hard hit is soybean farmersas their exports to China have fallen almost $20 billion over the past two years.
The Phase One deal includes very ambitious goals for China to buy U.S. agricultural products. These were going to be very hard to achieve under the best of circumstances, but with the Wuhan coronavirus there are already rumblings that these won’t be met.
This article originally appeared on Forbes.

