
This month we focus on some of the key messages from our review of asset class return expectations and resulting strategic asset allocation (SAA) changes. For the first time in a number of years, we are making some weighty adjustments to the design of our strategic portfolios. Like our selective tactical decisions through the cycle, we expect these changes to attribute returns to clients’ portfolios over the medium term.
In particular, the likely persistence of near-zero policy rates has led us to lower our strategic portfolio exposure to government bonds, while also lifting the weight in the ‘growth’ risk profile to alternative assets. We also introduce a more contemporary categorisation for the fixed income sub-asset classes, including a short maturity bucket, while removing the distinction between domestic and international assets. Finally, we now include the endowment risk profile as one of our key model allocations.
But first, we remain in favour of our modest risk-on stance
As we approach mid-year, growth momentum in the global and domestic economies has accelerated, much as we anticipated in our recent April edition Brace for strong growth. Leading indicators, such as global composite purchasing managers’ indexes (PMI) continued to pick up in April and May (particularly for the UK and Europe), signalling 6% plus growth for the world in 2021, which would be its fastest pace in about four decades.
Latest estimates by UBS suggest global growth over the year to Q1 2021 has returned to a solid 3% pace (from -9.0% mid-2020), buoyed by China’s 18% growth. While major advanced economies such as the US (0.4%), Europe (-1.8%) and Australia (0.4%) are still flat to moderately negative in Q1, the rebound from last year’s mid-year pandemic-led recession is expected to see all countries regather positive momentum through Q2 this year.
Key has been the increasing pace of the vaccine rollout and reduced mobility restrictions globally. There are clearly regional differences emerging, with India and other parts of Asia facing worsening virus conditions, while much of Europe, the US and the UK begin to remove restrictions as new case growth slows and vaccination rates rise (see the chart below).
The pace of vaccinations (% of population) has accelerated
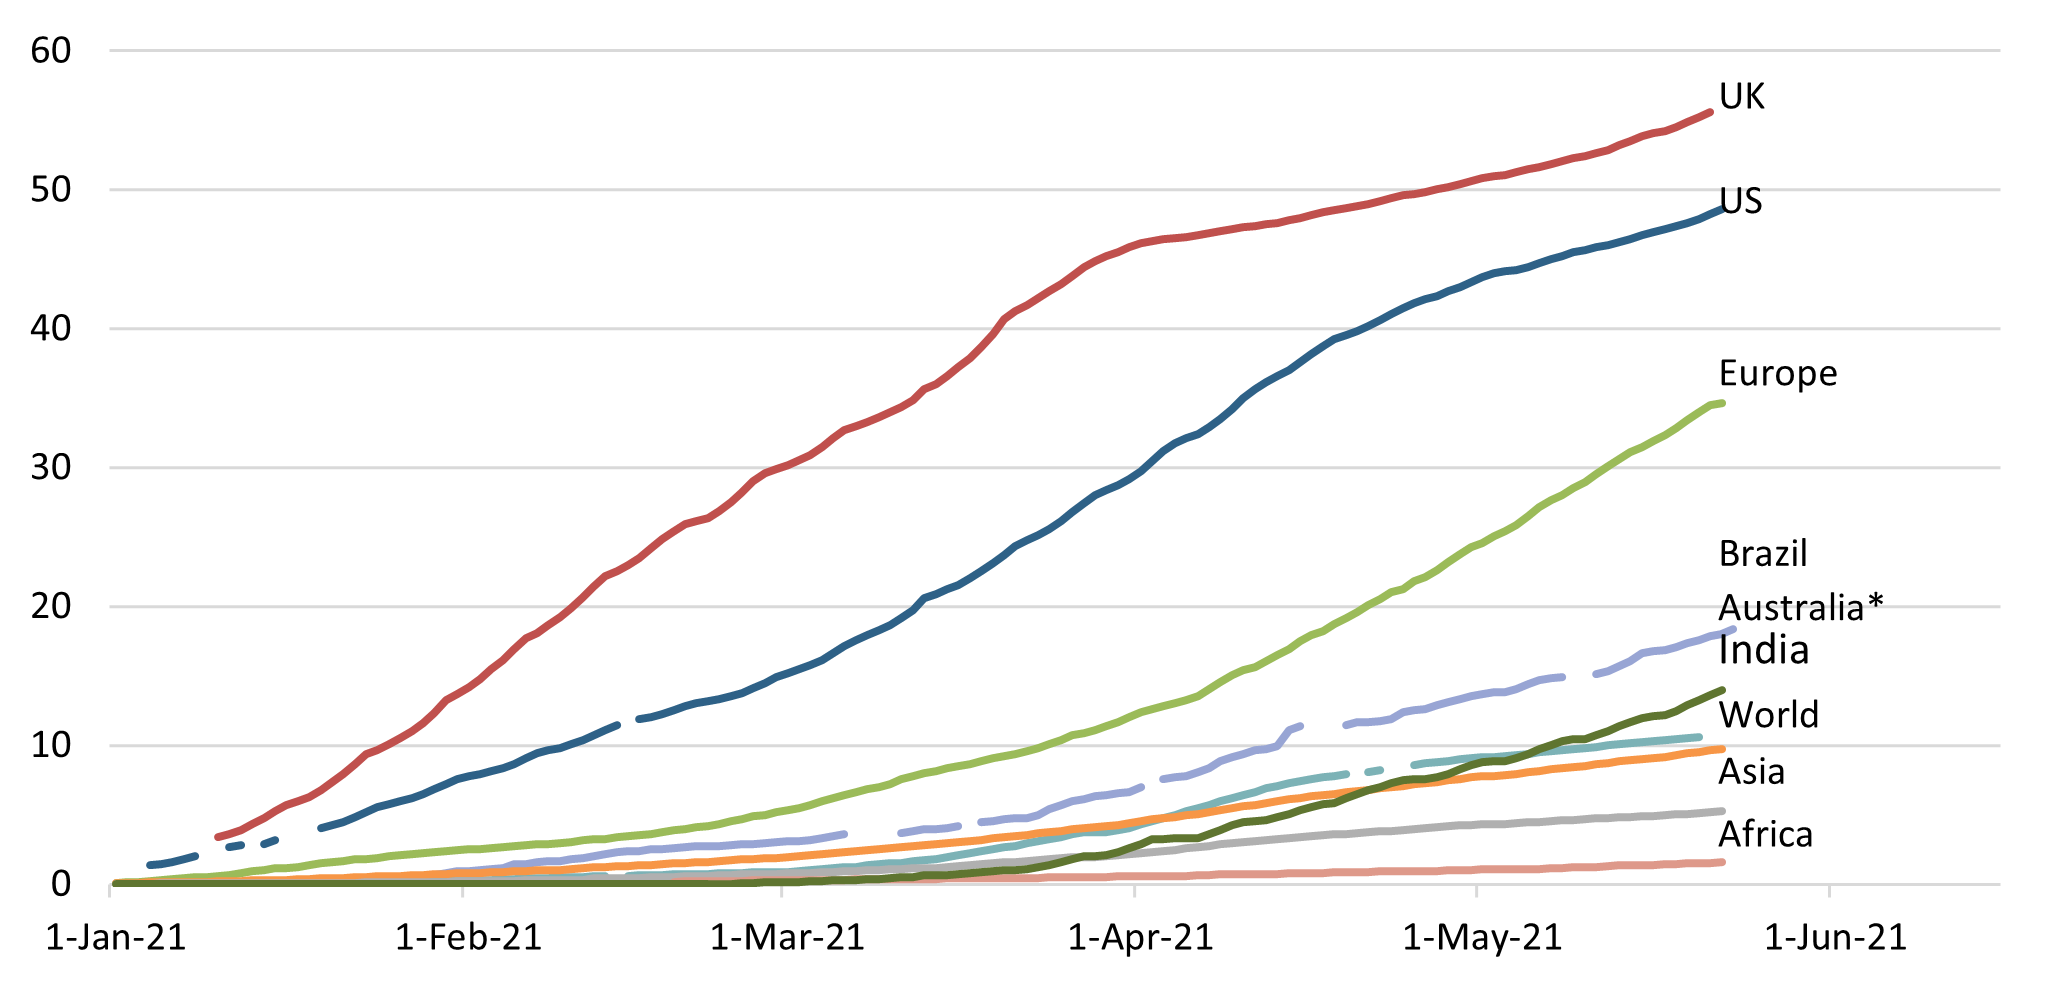
Source: Our World in Data, Crestone; * Australia is doses per 100 people.
The willingness of governments globally to add further fiscal stimulus has also been underpinning upgrades to the 2021 and 2022 growth outlooks for various regions. Following the USD 1.9 trillion package, discussions in the US focus on the latest infrastructure-focused Jobs Plan and Families Plan, both of which could add further moderate support to activity and sentiment during 2021 and 2022. During May, Australia’s government also added a larger-than-expected 2.5% of additional stimulus across 2021 and 2022. Still, the late-May Victorian outbreak and resulting lockdown is a reminder of the ongoing risks.
Inflation concerns weigh on equity markets
However, the pace of growth—in conjunction with a well-telegraphed spike in inflation during Q2—has initially caused angst through April and early May that central banks may remove stimulus earlier than expected. Over recent weeks, a number of factors have worked to calm equity market concerns (albeit not propel them higher). These include the quite narrow source of the inflation upswing; signs that China is past the peak in its rapid growth recovery and is also actively trying to ease commodity prices lower; and that US data has become less frenetic, with the recent ‘miss’ for jobs growth and retail sales.
Markets also appear to be taking some comfort from the US Federal Reserve’s (Fed) willingness to start thinking about tapering bond purchases, with both equities and bonds rallying over the past week. Announcements of tapering by other central banks have also been relatively calmly received.
The momentum in the global recovery could see inflation prove stickier near term, and we believe building inflation protection into portfolios is important on a three-year view. But for now, that momentum is most likely to appear in higher company earnings, consistent with our forecast for outperformance of equities relative to fixed income, given a rising yield outlook.
Four key changes to our strategic portfolio positioning
1. Lower bond and cash returns drive higher relative credit allocations
Return expectations for both cash and government bonds have been reduced again in the latest review of our capital market assumptions (CMAs). Central banks have clearly signalled their intent to keep cash rates near zero for a number of years to come to drive both growth and inflation higher in time.
While central bank efforts to limit any rise in bond yields are expected to continue for this year, an unfolding recovery in the domestic and global economies, not to mention the increased supply of government bonds given now more elevated debt levels, is likely to see bond yields trend higher (with some capital loss for bondholders) over the five-year outlook that defines our CMAs.
Lower absolute yields also erode the downside protection afforded by government bonds, reducing the diversification benefits within the portfolio. These changes have led to a number of adjustments to our portfolio SAAs:
- For balanced risk profiles, while the total fixed income allocation is largely unchanged, the allocation to credit has increased relative to both (from 30% to 49% of the total fixed income allocation).
- For growth risk profiles, the allocation to cash and fixed income has been reduced from 22% to 20%, with a similar increase in the allocation to credit as seen in the balanced risk profile (from 35% to 47%).
- For all model portfolios, the allocation to cash (operational liquidity) has been reduced from 5% to 3% (with the balance redirected to a new ‘short maturity’ sub-asset class in fixed income, discussed below).
2. Moving to a more ‘unconstrained’ fixed income asset allocation
The recent review of our recommended domestic and global fixed income fund managers confirmed a number of trends, which we have been watching for some time. In particular:
- The distinction between domestic and international fixed income has become progressively less pronounced, with return expectations almost identical for both asset classes and correlations rising to high levels. A theme which has been reinforced by a move to near-zero policy rates by major central banks. In contrast, listed equities still deliver significant diversification benefits from investing across different global regions.
- As noted above, with yields on cash close to zero, there is increasing focus on putting more of that cash (not required for pure operational liquidity) to work in more active solutions. While cash yields may be zero, inflation expectations are around 2% for the coming few years, arguing active decisions to minimise the loss of capital purchasing power.
Firstly, reflecting these trends, we have removed the distinction between domestic and international fixed income exposures.
Secondly, we have reduced the strategic position of cash from 5% to 3% in model portfolios to partly fund a new ‘short maturity’ sub-asset class. This will enhance the ability of portfolios to position for different yield environments and should be thought of as representing “high-quality income bearing securities with a high level of capital preservation across cash instruments, short-term bonds and credit markets”.
Finally, reflecting, among other things, the renewed focus on the distinction between different quality credit (including the central bank policy distinction that was most prevalent during the pandemic), we are separating credit into investment grade and high yield.
3. Raising alternatives allocation in growth from 16% to 20%
For the past couple of years, we have regularly focused on the benefits of a strong allocation to alternative assets. Alternatives are best thought of as a diverse range of assets that exists outside traditional investments like publicly traded equities, fixed income securities and cash. Given the differing return characteristics and drivers of risk among alternatives, they can add a variety of features to a portfolio. In particular, they can increase the return potential of a portfolio and also enhance diversification, as their return profiles are typically uncorrelated, or have a lower correlation, to broader market swings.
In our recent CMA review, return expectations for our key alternative assets, namely private markets, hedge funds and real assets, remained relatively robust. For both private markets (equity and debt) and real assets, return expectations moved moderately higher. In contrast, return expectations for hedge funds moved lower. Reflecting this, as well as other research we have been carrying out, we have made the following adjustments to our SAAs:
- Within the alternatives sub-asset classes, the weight to hedge funds, relative to private markets and real assets, has been modestly reduced.
- For the yield and growth risk portfolios, the weight of alternatives has been raised significantly from 16% to 20%, bringing them in line with the balanced portfolio. This reflects better relative return expectations for alternative assets. It also now reflects the greater access to a broader scope of both growth and defensive alternative assets.
- Reflecting the more illiquid nature of the asset class, we also have decided not to make tactical asset allocation decisions that impact the overall alternatives asset class.
4. Introducing (formally) our endowment model SAA
Last year, we published a detailed Observations article, A focus on endowment-style investing, which outlined our approach to this style of investing. We now formally introduce this SAA to our risk profile models. As we noted last year, when designing SAAs for more traditional risk profiles, they are often constrained by a range of factors, including volatility concerns, a need to match liabilities to a home country currency, as well as greater liquidity needs for those seeking regular income flows.
These factors will typically constrain the allocation to the more illiquid or more sophisticated alternative assets, notwithstanding the typically higher return profile of these assets. However, for endowment-style and some ultra-high-net-worth investors, typically with large corpuses, limited liquidity needs and the ability to focus almost exclusively on long-term returns, a higher allocation of alternatives may be appropriate. Key features for an endowment-style portfolio might include:
- A higher allocation to alternative investments than traditional risk profiles. This could be as high as 45% and would typically involve diversification across a wide range of both defensive and growth alternative investments.
- A higher allocation to international equities to capture long-term growth opportunities in regions other than Australia.
- A period of implementation where the size of the alternatives allocation grows as opportunities become available through time for high-quality opportunistic managers. Reflecting this, early-stage endowment portfolios are likely to have higher weights to cash or international equities as funding sources for future investments.
This article originally appeared on livewire.

