
The U.S. stock market has flirted with record highs this week, and this has caused many nerves flutter among investors. One of the reasons that stock traders have been feeling jittery about the S&P 500 index reaching its record high is the wave of selling that has eroded most of the gains during the final hours of the day.
Famous Saying
Remember the famous saying that novice traders, open the market, and professional traders close the market? Novice traders make most of their decisions on the back of fear or greed and trade over the first few hours of a trading day. On the other hand, professional traders sit and wait for the trend, and they pay attention to fundamentals.
The S&P 500 index has made stock traders anxious and made them think of a stock market crashbecause the S&P 500 experienced an intense sell-off during the final hours of trading on Tuesday, August 11th. The theme has been pretty much the same since then. The selling wave came late in the day, and when it hit the S&P 500 and the Dow Jones indices, the U.S. stock market began to lose its balance.
Smart Money Index
The S&P 500 index had several attempts at a record high this week, and it has failed to break above this level. Bloomberg terminal has a smart money index, and it shows that smart money is easing off the gas as the stock market continued to charge higher.
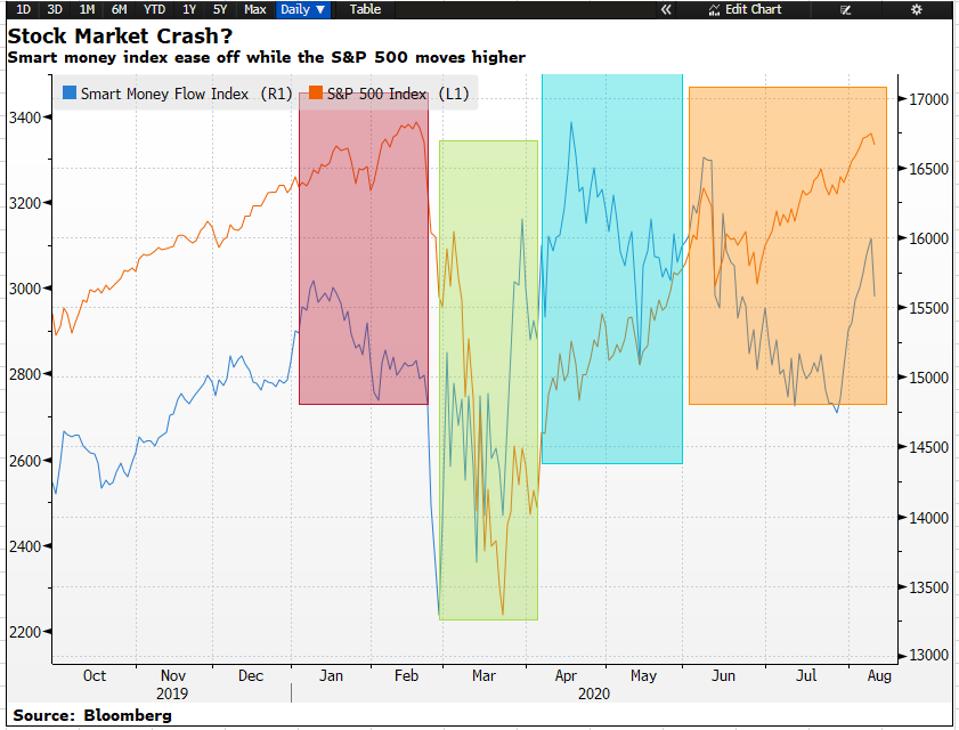
Smart Money Index shows that traders have become nervous as the S&P 500 is struggling to move beyond ... [+]
BLOOMBERG, AVATRADEIt is critical to mention that this smart money index doesn't necessarily mean that the decision it takes is necessarily the right one. As, during mid-April to mid-May, the smart money index did fall, but there was no stock market crash.
However, the smart money index shows that smart capital inflow was on the sidelines during early January, while the S&P 500 index continued to move higher. We all know what happened after that; the stock market crashed.
From mid-March to mid-April, both the Smart Money index and the S&P 500 moved in the same direction. The smart money was able to spot the bottom. By looking at the Smart index's current action, it becomes evidently clear that it is leaving the playground.
One of the reasons could be that the S&P 500 index isn't showing any convincing signs that it can move beyond the record highs for the time being.
So the question for traders and investors remains as to how we can make some sense of this, and what is the path of least resistance? But, before we do that, lets lay down some necessary foundations.
Are Stocks Going Up or Down?
The Nasdaq index has made a record high this year, and the S&P 500 index has been only a few points shy of its record high. The Dow Jones index is almost 6% away from touching the all-time high.
In simple terms, the U.S. stocks have seen a strong uptrend since the coronavirus stock market crash. The Nasdaq index has been the leading index.
The S&P 500 index is up over 46%, the Dow Jones has advanced 45%, and the Nasdaq has soared 60%. The below chart shows the percentage performance for the U.S. stock indices since March 20th this year.
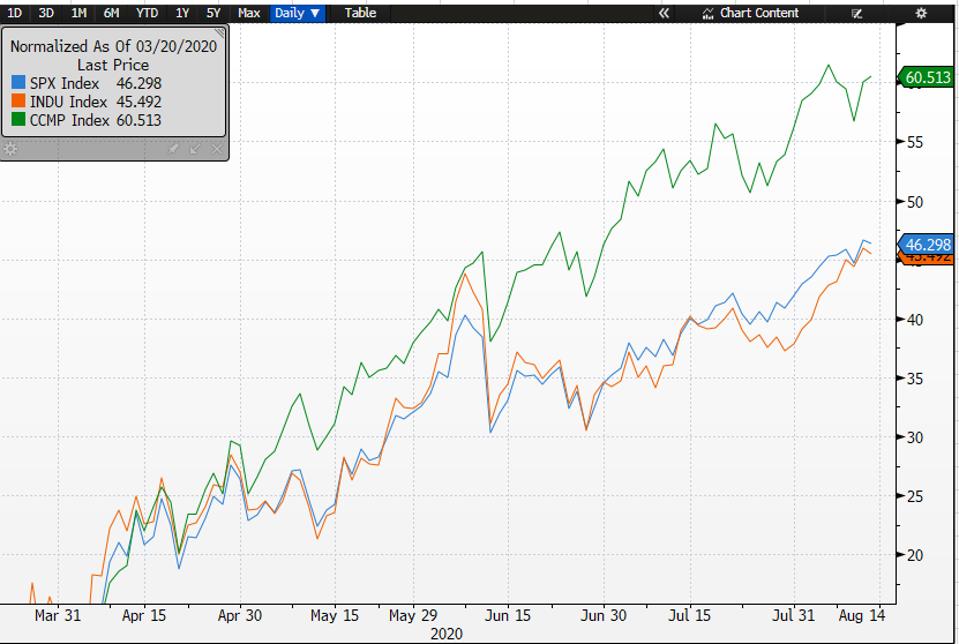
The chart shows percentage appreciation for the Dow Jones, the Nasdaq and the S&P 500 index. The ... [+]
BLOOMBERG, AVATRADEIs This a Bubble?
The stock market performance is not necessarily a true reflection of the economy. However, one aspect which many may agree on is that the U.S. labor market has experienced a decent improvement from its peak readings. For instance, the Initial Jobless Claims have fallen below the one million mark since the coronavirus pandemic.
The dominant trend for the Continuing Claims and Initial Jobless Claims has been to the downside, which means fewer Americans are filing jobless claims. The U.S. unemployment rate has also fallen to 10.5%, and we may see it going to a single-digit territory as well.
The recent U.S. quarterly GDP is something that makes stock traders nervous and makes them think that the current stock bubble can pop, and the stock market crash may happen.
Given the fact that the economic activity in the U.S. has resumed, it is likely that the next quarterly GDP reading may show us a strong number and that may justify why the stock market is at the level where it is now.
Can the Bubble Pop?
The S&P 500 needs to continue its journey beyond the current record high. If it starts to consolidate at this level, it may make many stock traders nervous. Technical analysts will start saying that the S&P 500 index has formed a double top (shown below), one of the most reliable bearish signals, and a small pullback could create significant chaos.

The S&P 500 chart shows that the index could be forming a bearish pattern, a double top.
AVATRADEFor the S&500 index to move higher and convince stock traders about its strength, we need the momentum and push from some of the lagging sectors of the S&P 500 index. These S&P 500 sectors are energy, financial, real estate, and industrial. Without their help, any upward move for the S&P 500 index may always raise questions.
The Bottom Line
Traders are nervous that the S&P 500 index won't be able to cross above the record high and is losing momentum at this point. This is making stock traders lose their faith in the stock market rally. The stock market needs new a catalyst, and the S&P 500 needs to move above the all-time high to assure traders that this coronavirus stock rally isn't ready to crash yet.
This article originally appeared on Forbes.

