
(Yahoo!Finance) - Stocks climbed last week, with the S&P 500 jumping 4%. The index is now up 9% from its October 12 closing low of 3,577.03 and down 19% from its January 3 closing high of 4,796.56.
The broad market rally, however, belies some big selloffs among some of the biggest stocks on the planet.
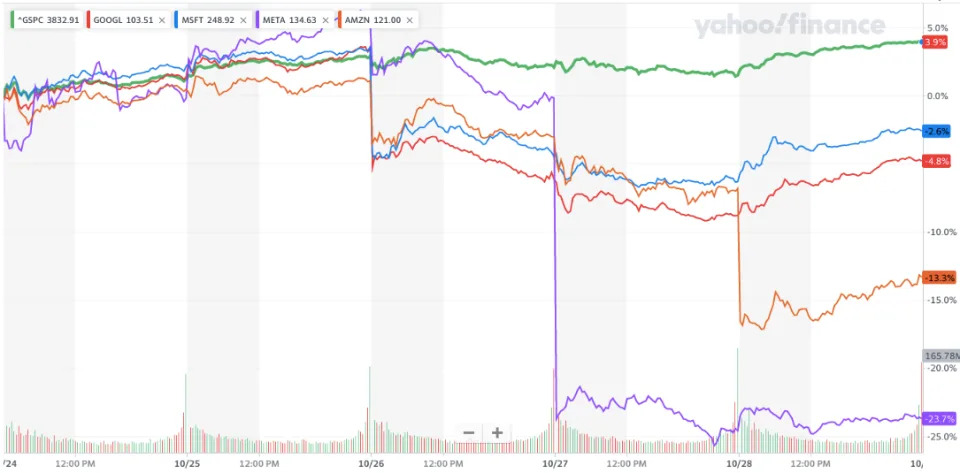
Last week, Microsoft MSFT 4.97%↑, Alphabet GOOGL 4.89%↑, Amazon AMZN 8.66%↑, and Meta Platforms META 0.33%↑ shares fell 3%, 5%, 13%, and 24%, respectively, as the companies gave disappointing quarterly results. All four of these names have been underperforming the S&P basically all year.
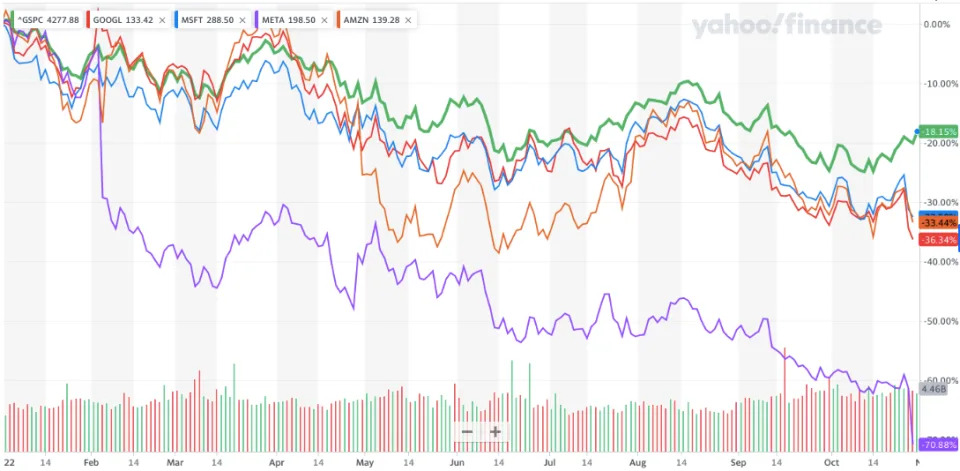
This means investors with concentrated exposures to these companies have been experiencing a much more painful 2022 than those in low-cost, passively managed S&P 500 index funds.
All of this speaks to the merits of diversification. By investing in a variety of assets that aren’t closely correlated, you limit the ability of a handful of stocks to ruin your finances.
Of course, diversification comes with some opportunity costs. Specifically, it prevents investors from fully cashing in on the massive gains that are sometimes generated by a handful of stocks.
Unfortunately, it’s extraordinarily difficult to identify which stocks will become the big winners and losers. On top of that, it’s extraordinarily difficult to know when those winners and losers will generate their gains and losses. In fact, the vast majority of professional stock pickers aren’t able to do any of this successfully on a consistent basis. And as a result, most pros underperform the market.
It can be frustrating to see folks with concentrated positions rake it in on some big winners. But it’s during weeks like this that diversified investors should remember to be grateful that they aren’t getting totally smoked.
Reviewing the macro crosscurrents ?
There were a few notable data points from last week to consider:
? The economy is slowing. Gross domestic product (GDP) grew at a 2.6% rate during the third quarter, according to BEA data released Thursday. This follows negative GDP prints in Q1 and Q2. However, the headline GDP number always includes a lot of noise that doesn’t give a good picture of the economy.
To get a better sense of the underlying health of the U.S. economy, many economists will point to “final sales to domestic purchasers,“ which strips out net exports and changes in inventories. This measure increased at a more modest 0.5% annualized rate in Q3.
If you strip government spending from that measure, “final sales to private domestic purchasers” was barely positive, climbing at a 0.1% rate in Q3, down from 0.5% in Q2.
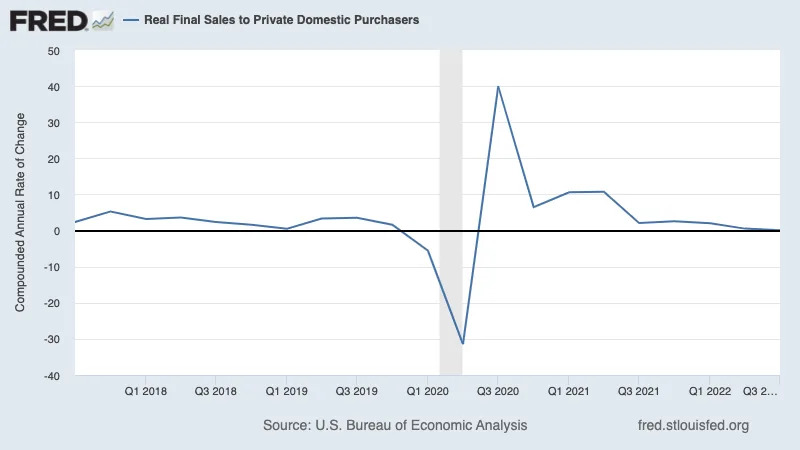
“This series usually means next quarter GDP growth will be soft,“ Neil Dutta, head of economics at Renaissance Macro Research, said on Thursday.
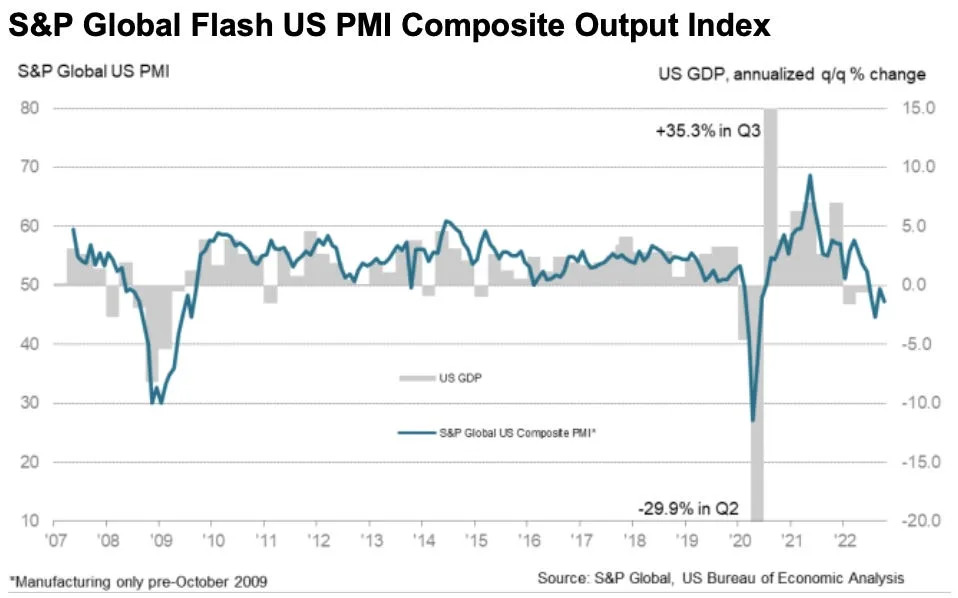
? Early Q4 data doesn’t look good for the economy. The S&P Global Flash US PMI Composite Output Index signaled contraction in economic activity in October. From the report: “The US economic downturn gathered significant momentum in October, while confidence in the outlook also deteriorated sharply. The decline was led by a downward lurch in services activity, fueled by the rising cost of living and tightening financial conditions. While output in manufacturing remains more resilient for now, October saw a steep drop in demand for goods, meaning current output is only being maintained by firms eating into backlogs of previously placed orders. Clearly this is unsustainable absent of a revival in demand, and it’s no surprise to see firms cutting back sharply on their input buying to prepare for lower output in coming months.“
Several U.S. states are already in contraction. From the Philly Fed’s September State Coincident Indexes report: “Over the past three months, the indexes increased in 44 states, decreased in four states, and remained stable in two. ... Additionally, in the past month, the indexes increased in 38 states, decreased in 10 states, and remained stable in two…”

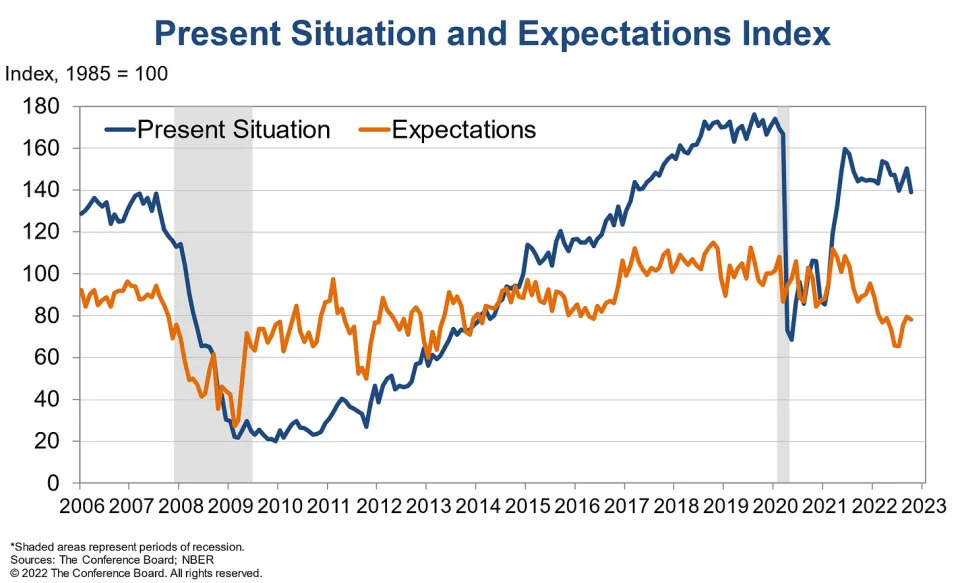
Consumer confidence deteriorates. From The Conference Board’s Lynn Franco: “Consumers’ expectations regarding the short-term outlook remained dismal. The Expectations Index is still lingering below a reading of 80 — a level associated with recession — suggesting recession risks appear to be rising. Notably, concerns about inflation — which had been receding since July — picked up again, with both gas and food prices serving as main drivers. Vacation intentions cooled; however, intentions to purchase homes, automobiles, and big-ticket appliances all rose. Looking ahead, inflationary pressures will continue to pose strong headwinds to consumer confidence and spending, which could result in a challenging holiday season for retailers. And, given inventories are already in place, if demand falls short, it may result in steep discounting which would reduce retailers’ profit margins.“
The housing market is taking a toll on the economy. According to the Q3 GDP report, residential investment fell at an annualized rate of 26.4% during the period. That shaved about 1.4 percentage points off of GDP growth.

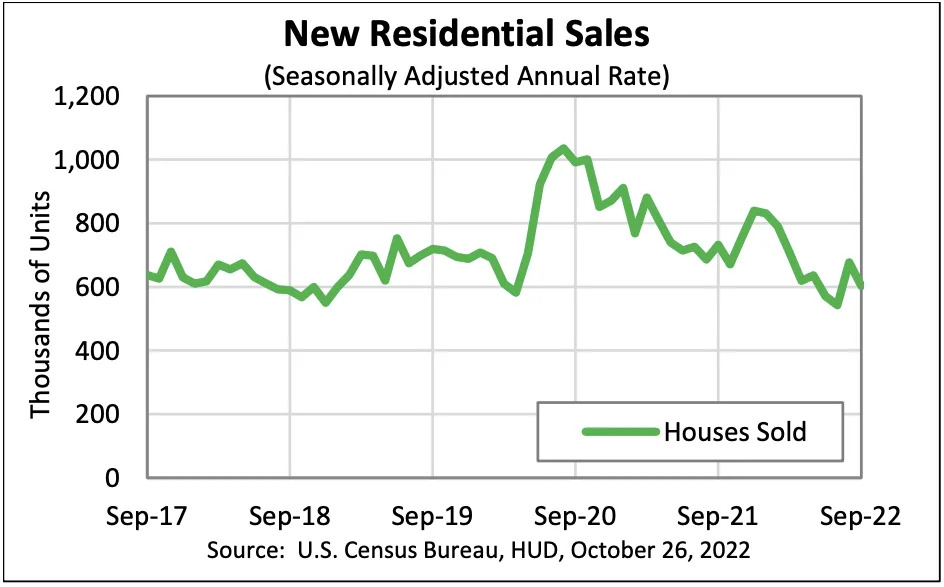
New home sales fall. According to the Census Bureau, the pace of new home sales in September fell to an annualized rate of 603,000 units, down 10.9% from the month prior.
Home prices cool. According to the S&P CoreLogic Case-Shiller index, home prices fell 0.9% month-over-month in August, the second consecutive month of declines. On a year-over-year basis, prices were up 13.0%, down from 15.6% the month prior. From S&P DJI’s Craig Lazzara: “The -2.6% difference between those two monthly rates of change is the largest deceleration in the history of the index. … As the Federal Reserve moves interest rates higher, mortgage financing becomes more expensive and housing becomes less affordable. Given the continuing prospects for a challenging macroeconomic environment, home prices may well continue to decelerate.” To better understand why government inflation data appear to lag these trends, read this.

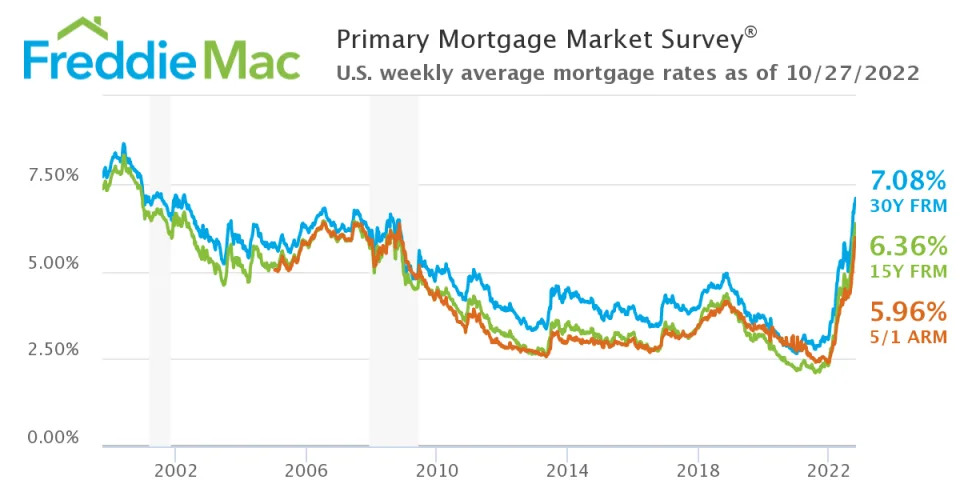
Mortgage rates continue to rise. According to Freddie Mac, the average 30-year fixed-rate mortgage rose to 7.08%, the highest level since April 2002. From Freddie Mac: “The 30-year fixed-rate mortgage broke seven percent for the first time since April 2002, leading to greater stagnation in the housing market. As inflation endures, consumers are seeing higher costs at every turn, causing further declines in consumer confidence this month. In fact, many potential homebuyers are choosing to wait and see where the housing market will end up, pushing demand and home prices further downward.”
Business investment is starting to cool. Shipments of nondefense capital goods excluding aircraft — a.k.a. core capex or business investment — fell 0.5% in September after 18 consecutive months of gains. Core capex orders fell 0.7% after six consecutive months of gains.

? Inflation is still hot. According to BEA data released Friday, the core PCE price index — the Fed’s preferred measure of inflation — was up 5.1% in September from a year ago. This is up from the 4.9% rate in August but down from the 5.4% peak rate in February. It remains well above the Fed’s 2% target rate.

On a month over month basis, the core PCE price index climbed 0.5%, which is well above pre-pandemic levels.

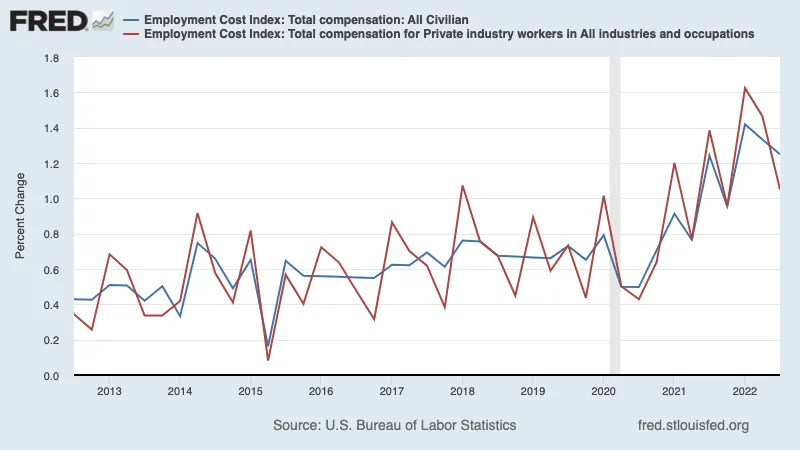
? But wages may be cooling. According to the BLS’s Employment Cost Index (ECI), total compensation for all workers in Q3 was up 5.0% from a year ago, unchanged from Q2. However, total compensation for private sector workers was up 5.2% in Q3, down from 5.5% in Q2.
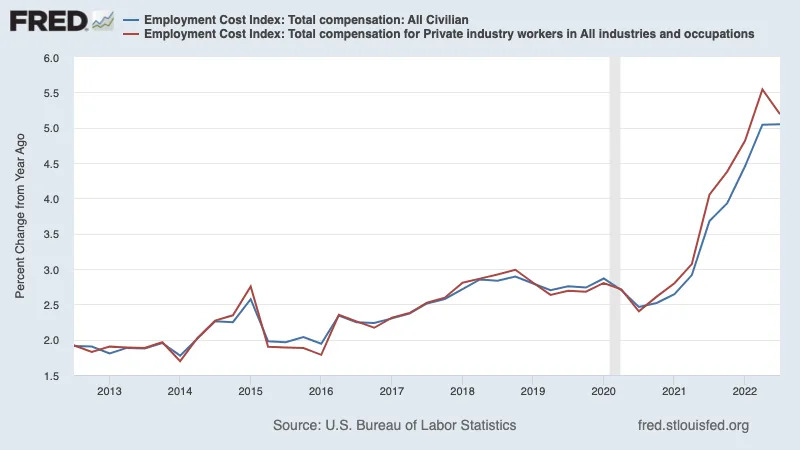
On a quarter-over-quarter basis, ECI growth cooled to 1.2% in Q3 from 1.3% in Q2. For private sector workers, ECI growth slowed to 1.1% from 1.5%.
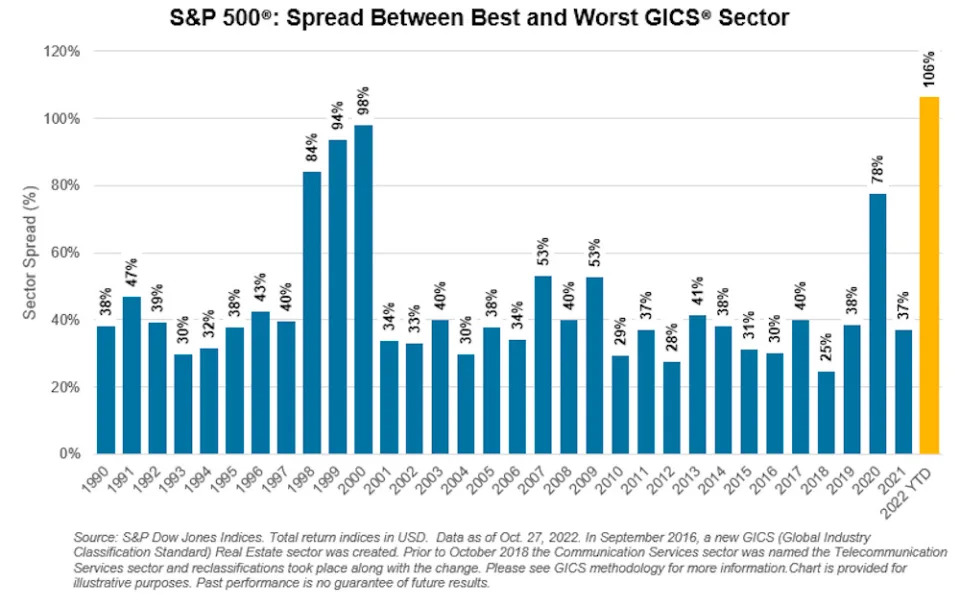
? S&P sectors diverge. The difference between the best performing sector and the worst performing sector in the S&P 500 has never been greater. From Benedek Vörös, director of index investment strategy at S&P Dow Jones Indices: “Energy has now extended its lead against laggard Communication Services to 24% this month and an absolutely eye-watering 106% year-to-date. 2022 looks set to host the widest annual spread between the best- and worst-performing S&P 500 sectors, ever. “
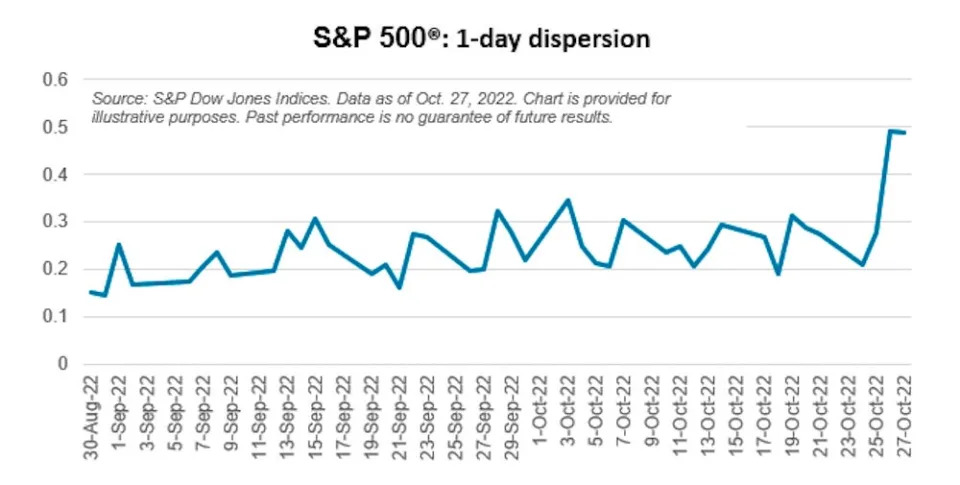
? S&P stocks diverge. Individual stocks in the S&P 500 are moving independent of each other. From SPDJI’s Vörös: “October typically displays an uptick in single-stock dispersion, and burdened with Big Tech disappointments, this year seems to be no exception. The 1-day dispersion in S&P 500 single constituent performances has increased to an average of 28% annualized month-to-date, vs. September’s average of 23%, with the past two trading days coming in at 50% annualized.“
Putting it all together ?
The economy is slowing. It may even be contracting.
Even business investment, a major tailwind for the economy, seems to finally be turning.
All of this can be explained in part by the Federal Reserve’s aggressive effort to bring down inflation by inflicting “pain” on the economy with higher interest rates.
Indeed, surging mortgage rates have caused the housing market to turn cold,
The good news amid all of this bad news is that the bad news seems to be having its intended effect: Inflation pressures are easing. Home prices are coming down. Wage growth is cooling. And all of the supply chain pressures that have been fueling inflation have eased considerably.
The question is whether or not these developments constitute “compelling evidence” that inflation is indeed under control. Broad measures of inflation like the CPI and the PCE price remain elevated, which suggests it may be too early to claim victory. We may get some clarity next Wednesday as Fed Chair Jerome Powell addresses the public following the central bank’s monetary policy meeting.
That said, there’s still a strong case to be made that any downturn won’t turn into economic calamity given that the financial health of consumers and businesses remains very strong.
And long-term investors should remember that recessions and bear markets are just part of the deal when you enter the stock market with the aim of generating long-term returns. While markets have had a terrible year so far, the long-run outlook for stocks remains positive.
By Sam Ro · Contributor

