
The reported “surge” in the Consumer Price Index for April is misleading, and should not be taken at face value.
The 4.2% rise in the headline number is driven by many factors. Some are fundamental — which is to say, they represent real economic phenomena. The April increase certainly reflects strong economic growth – strong demand as the pandemic lockdowns end, interacting with supply shortages that develop as businesses readjust to the sudden upwards shift in demand. The economy is experiencing the classic somewhat out-of-balance recovery that follows a shock or recession.
However, there are also technical factors created by quirks in the way the CPI is calculated. These are unrelated to the performance of the economy. They can be viewed as inherent flaws or biases in the index, which distort the meaning of the reported inflation figures.
The existence of bias in the CPI has long been recognized. In 1996, a Congressional commission concluded that the CPI overstated the annual reported inflation rate by 1.1%. The commission’s report underscored the seriousness of this problem:
- “This bias might seem small, but when compounded over time, the implications are enormous. If inflation as measured by the percentage change in the CPI is running 3 percent, the true change in the cost of living is about 2 percent. Over a dozen years, the cumulative additional national debt from overindexing the budget would amount to more than $1 trillion. The bias alone would be the fourth largest federal spending program, after social security, health care and defense.”
Despite the commission’s recommendations, the CPI is still the official inflation figure used to compute cost-of-living increases in federal programs such as social security and other entitlements, and continues to be seen as the “headline” number.
Today, in light of the seemingly elevated April CPI, the question looms: Is serious, persistent, “structural” inflation really back?
A proper answer should distinguish between the fundamental signal and spurious technical elements – which artificially jacked up the reported inflation rate for April.
A deconstruction of the CPI should take into account at least four of these technical factors.
- The distinction between “Headline” and “Core” Inflation
- The difference between the CPI and the PCE (Personal Consumption Expenditure Index)
- The Base Effect
- Clearly Anomalous Increases in Certain Components of the Index
Core vs Headline
This first factor is well-known, although under-emphasized in many media accounts. Since 2000, the Federal Reserve has relied on inflation measures which exclude food and energy prices. The adjusted version of the CPI is called the Core Inflation rate.
Core inflation in April was 2.96% – a third lower than the 4.15% unadjusted CPI.
The following charts show why the Core is preferable. The issue is volatility.
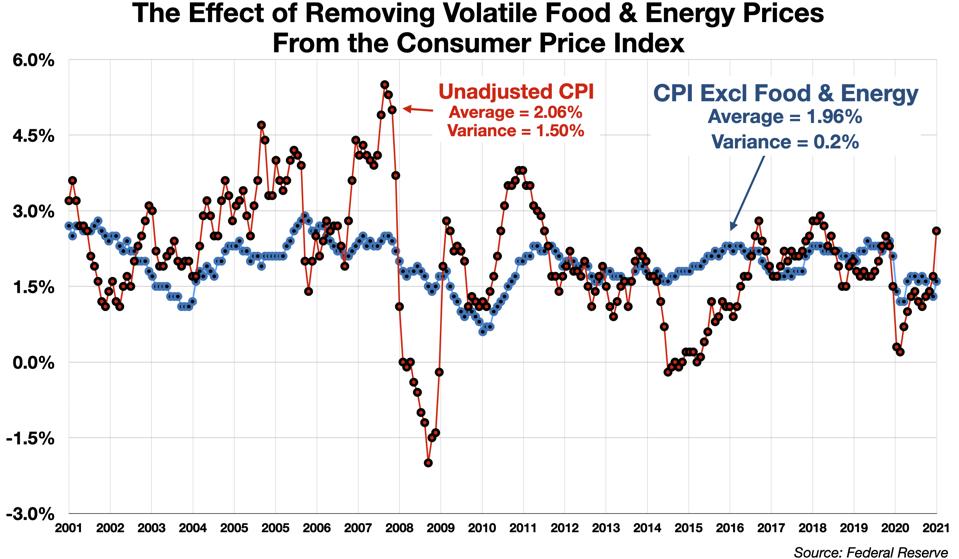
CPI vs CPI Excluding Food & Energy, 2001-2021
CHART BY AUTHOR
The variance of the unadjusted CPI is over 7 times greater than the variance of the Core index. Energy prices are about 25 times more volatile than the Core.
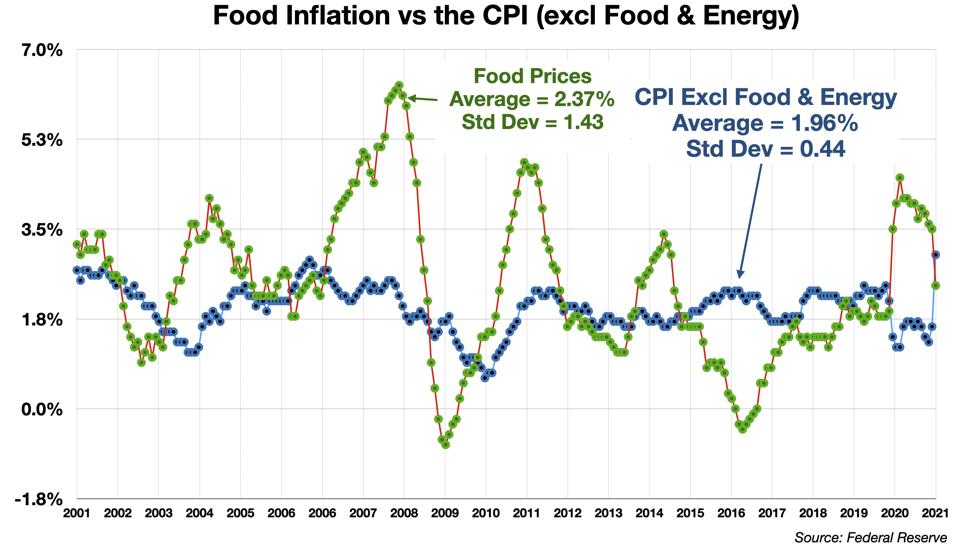
Food Inflation vs the CPI
CHART BY AUTHOR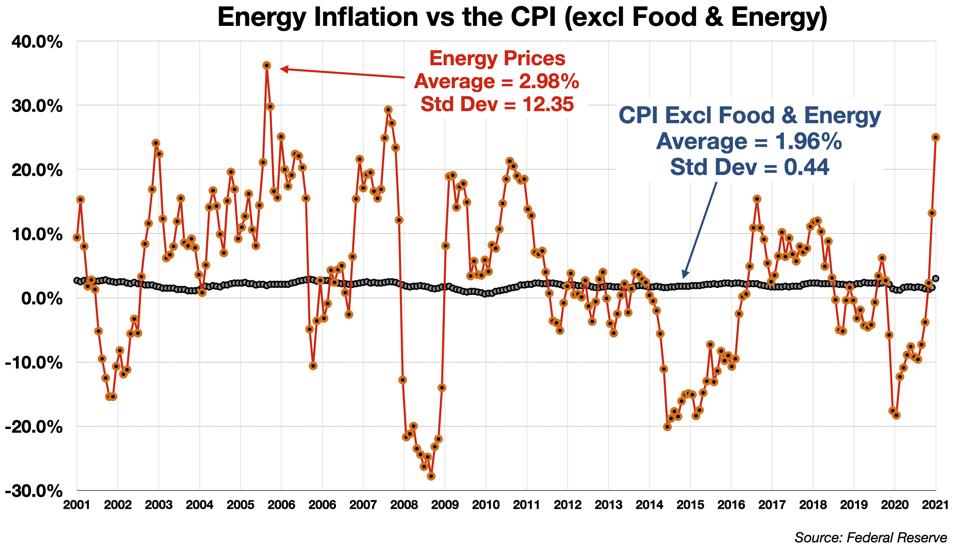
Energy Inflation vs the CPI
CHART BY AUTHORIncluding these volatile components distorts the CPI, and the effect can last for years. From 2015-2017, for example, the Headline CPI was 1.3% lower on average than the Core CPI, due to deflation in oil and food prices. From 2010-2012, the Headline CPI was 1.1% too high. It’s a trees-vs-forest situation. The volatility makes it hard to understand what is really happening, right now, big-picture.
Some have sometimes painted this preference for the Core as quasi-elitist, e.g.,
- “Only in a rich nation could one exclude nourishment and staying warm as anything other than ‘core.’”
But this is specious. Various government programs exist to subsidize consumer food or energy costs where appropriate. But the Federal Reserve policies which are influenced by inflation metric include changes in interest rates or the money supply, which impact the entire economy. Policy-makers need a reliable measure of the current economy-wide price trend. They need information that is up-to-date. The volatility of food and especially energy is so great that it tends to obscure that trend, deviating significantly over periods lasting sometimes several years. Policy decisions cannot afford to wait for these swings to average out.
CPI vs PCE
The CPI is produced by the Bureau of Labor Statistics, which is a branch of the Department of Labor. There is a competing measure of inflation, known as the Personal Consumption Expenditures Index (PCE), which is prepared by the Department of Commerce. The PCE is viewed as superior in several respects. The Federal Reserve switched from the CPI to the PCE in 2000.
- “The PCE has several advantages relative to the CPI. [It] avoids some of the upward bias associated with the CPI. …[and] is a more consistent series over time in assessing the path of inflation.”
- “The CPI overstates the true inflation rate. Continuing to use the CPI would imply over-adjusting for inflation… The FOMC carefully considered both indexes [the CPI and the PCE] when evaluating which metric to target and concluded that PCE inflation is the better measure…. PCE should become the standard.”
The PCE inflation figure is typically about 0.3% lower than the CPI figure.
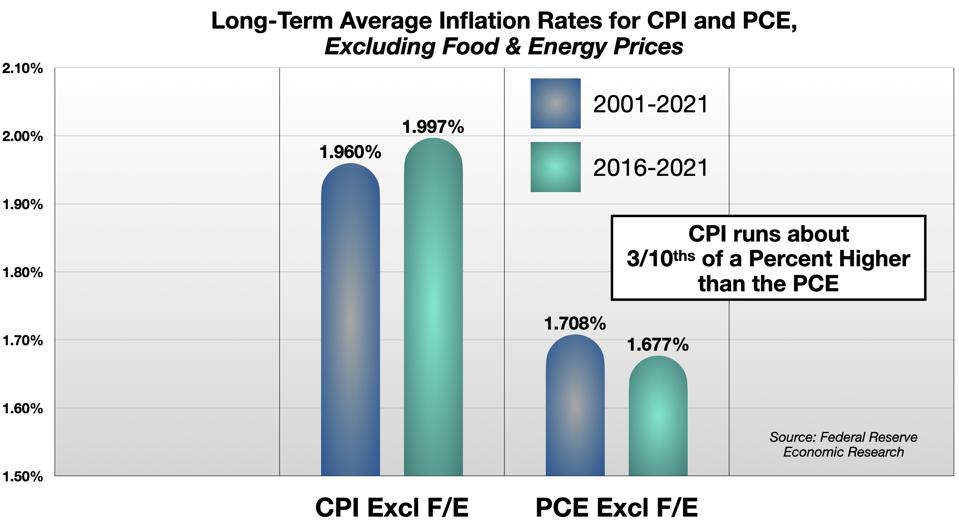
CPI vs PCE
CHART BY AUTHOR
The PCE for April has not been published (it is due May 28). If the relationship holds, the PCE (excl food and energy) would come in around 2.7%.
The Base Effect
A previous column described the so-called “base effect” — which is an anomaly caused by the way the headline CPI is calculated.
The pandemic paralyzed business activity starting in March 2020. It crushed consumer demand, and depressed prices and the CPI. This dip lasted for at least 6 months.
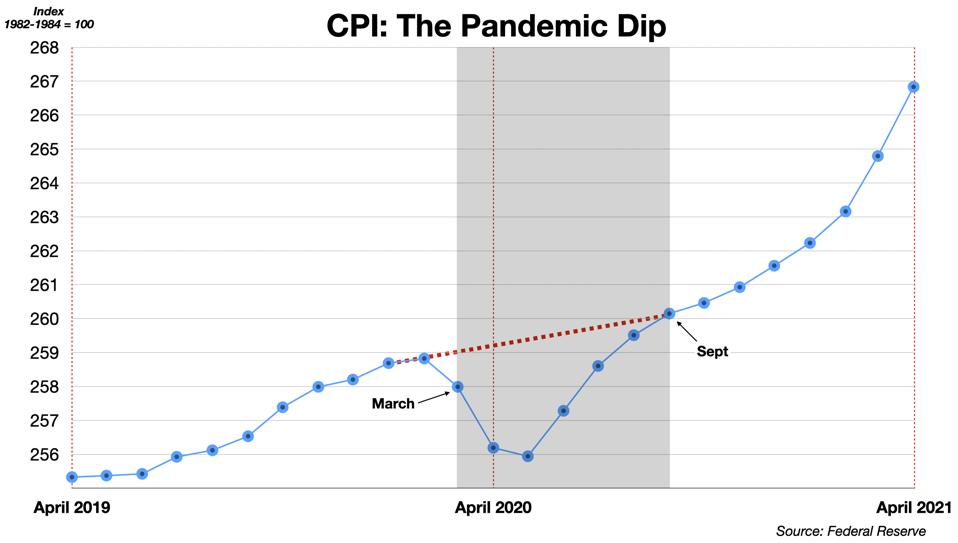
The CPI Dip Caused by the Pandemic
CHART BY AUTHOR
The CPI for April 2021 is calculated relative to the “base” of April 2020. Because of the pandemic dip, the base was depressed by approximately 1.2% below the trend line.
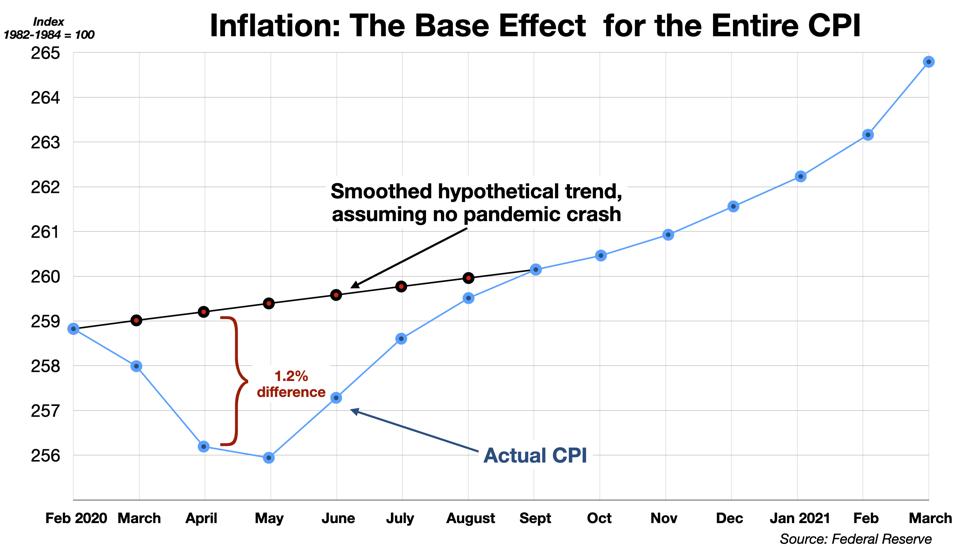
The Base Effect in the CPI for April 2021
CHART BY AUTHORThis means, mechanically, that the current month’s CPI is inflated - relative to what we should have seen if there had been no pandemic dip. The base effect boosted the apparent year-over-year inflation in April in the CPI by 1.2%.
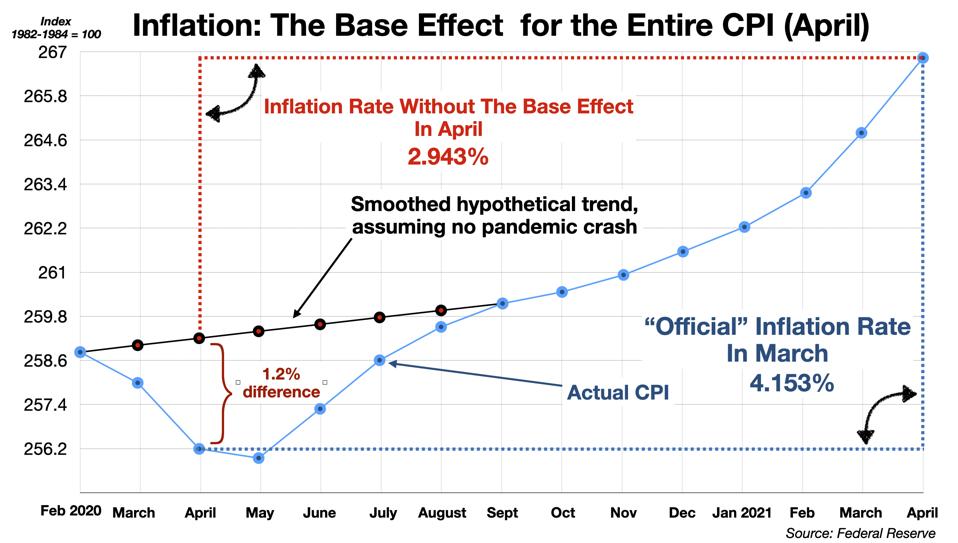
The CPI Base Effect for April
CHART BY AUTHORIn short, had there been no pandemic, the headlines would have been reporting a 2.9% inflation figure for last month, instead of a 4.2% rate.
Variations in the Base Effect
The base effect relies on a “hypothetical,” a what-if scenario. What if there had been no pandemic. Some may dismiss it for that reason. However, it is a useful perspective to help interpret the current headline figure. The prior trend was steady (going back at least five years it is a nearly straight line). Economists generally agree that the base effect distorts the meaning of the headline number.
Anomalies in Certain Components of the Index
The composition of the Index is a mine-field of methodological problems and challenges to interpretation. The question here is whether the April result foretells a trend that will continue, or is simply an anomaly not likely to be repeated. Two examples suffice to illustrate the problem.
In April, the two largest year-on-year price increases among the components of the CPI “basket” (the goods and services that the typical consumer is said to purchase on a regular basis) are (1) Energy (25.1% increase over April 2020), and (2) Used Cars (21% increase). These are large increases, which call for critical assessment.
Energy
A year ago, readers may recall that crude oil prices crashed, even going briefly negative. They have now recovered to where they were at the beginning of 2020.
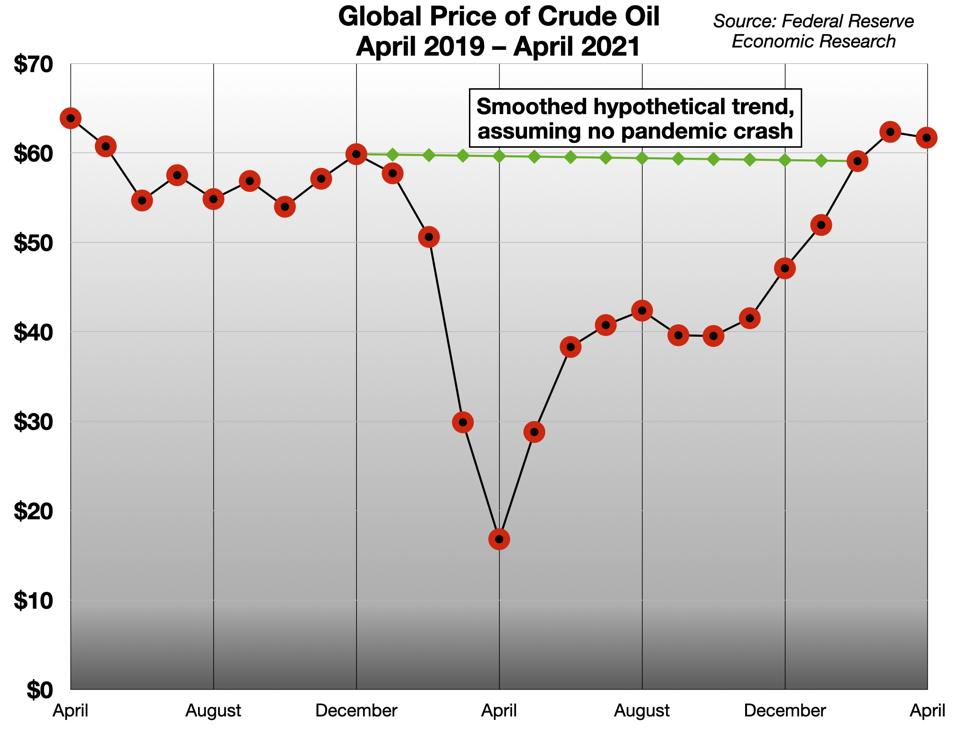
Global Price of Crude Oil - April 2019-April 2021
CHART BY AUTHOR
There are two very different ways to look at the April 2021 price of Crude: either it represents an enormous jump – more than tripling in 12 months – and could be seen as a powerful inflation signal, or… it is simply a recovery from the pandemic-induced collapse to the prior price level.
The clarifying follow-up question is: Do we expect the 300% rise since April 2020 to continue on the same upward path? In other words, will this trend be sustained? Or do we expect the price to stabilize more or less where it is? The current price is about 10% below the 10-year average and 10% above the 5-year average, which supports the second interpretation.
There is also clearly an extreme “base effect” in the energy price trend. Adjusted for this, the crude oil price increase would be just 3% April 2021-to-April 2020 (not 300%).
The energy price anomaly should be thus discounted. Even the alarmists at the Wall Street Journal admit that including the energy factor strongly skews the April CPI.
- “The April surge compares to a price decline last spring at the height of the pandemic lockdowns, and the comparisons will look less ugly in coming months. Oil prices were also hitting lows last spring as demand plunged. Remove those factors and the CPI increase looks barely above 2%.”
Used Cars
Used car prices were up 21.0% in April (year over year). Media reports have made much of this spike. CBNC sees it “as a key inflation indicator.”
This is a misreading of the situation. The jump in used car prices reflects a severe, but clearly temporary, mismatch in demand and supply.
On the demand side, the pandemic caused some consumers (whose employment was interrupted) to economize, probably adding to the demand for used cars, displacement from potential new car sales. On the supply side, a chip shortage has hampered production of new cars, which also pushed some buyers to the used car market.
- “Global automakers have been struggling with production thanks to a worldwide shortage of semiconductors, which has forced them to idle plants and has made it difficult for dealers to keep their lots stocked. That’s pushed up sticker prices in the new car market and nudged more shoppers toward preowned vehicles. Used car sales hit 3.4 million in April, up 58 percent from a year earlier.”
The real driver of the price squeeze, though, is the turmoil in the rental car business, which was severely whipsawed by the pandemic. Rental demand and prices plunged, then surged, then fell back, then surged again. The base effect April-to-April is enormous – prices for car rentals rose 82% year over year, more than any other component of the CPI.
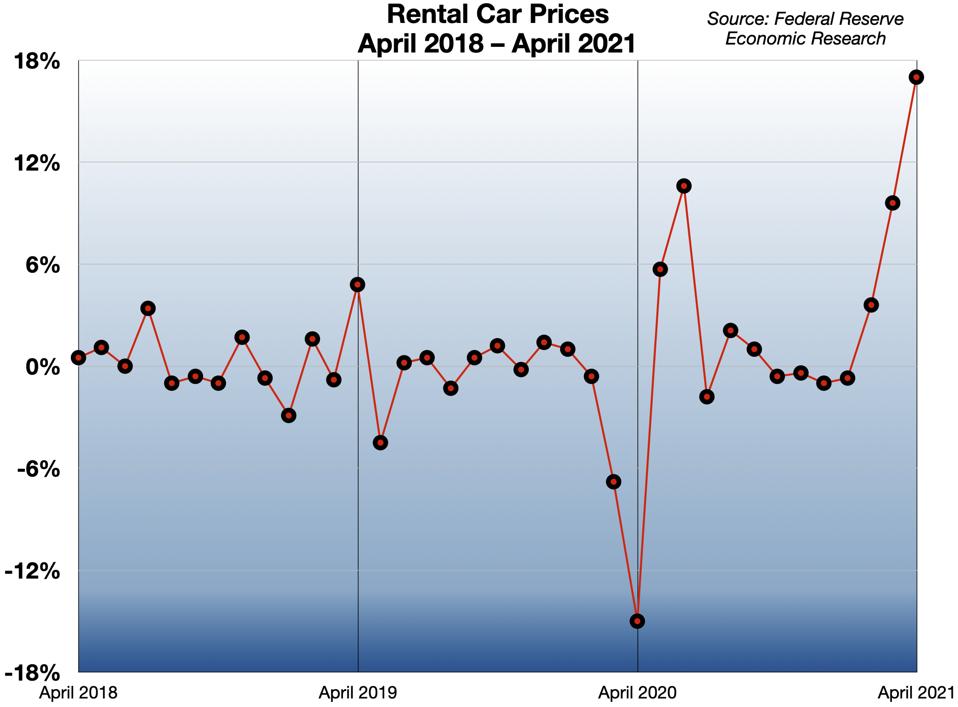
Rental Car Prices 2018-2021
CHART BY AUTHORAs they tried to navigate this turbulence last year, rental car companies at first rushed to unload their inventories as demand fell and prices dropped. These companies are traditionally a major source of supply of used cars.
- “Ordinarily, corporations like Hertz and Enterprise sell millions of old cars and trucks back to dealers each year as they refresh their fleets. That’s not happening at the moment, because, rental companies already sold off a huge chunk of their fleets early on in the pandemic when nobody was traveling in order to raise cash and stay afloat.”
The industry shed almost 800,000 vehicles last year. Hertz sold half its fleet, and yet could not avoid bankruptcy. Budget (incl Alamo and National) also filed Chapter 11. Avis, facing 67% revenue decline, sold a quarter of its fleet, cut 60% of its workforce and skated through, just barely.
Now that demand has surged again, they need to replace that capacity. New cars are in short supply, so rental car companies are buying up used cars.
- “The semiconductor shortage has slashed vehicle production so much that rental-car companies can’t get the new cars they need, so they have resorted to buying used vehicles at auction. This is uncharted territory for the likes of Hertz Global Holdings Inc. and Enterprise Holdings Inc., which have made their profits by purchasing new vehicles cheaply in bulk, renting them out for as much as a year and selling them at auction. With new cars in short supply, more consumers are turning instead to used models.”
In other words, the rental car giants have disrupted the used car market, and distorted prices, on boththe supply side (as their pipelines emptied out last year) and the demand side (they are now buying used cars themselves). Instead of satisfying consumer demand today, they are competing with it.
This “uncharted territory” is clearly an anomaly, not the normal way of doing business in this industry. It is caused by unusual market stress — a “bottleneck,” not a structural change in the economy.
The impact of this one component on the broad CPI for April is significant:
- “The index for used cars and trucks rose 10.0 percent in April. It accounted for over a third of the seasonally adjusted all items increase.” – The Bureau of Labor Statistics
The phrase “all items increase” here refers to the 4.2% headline number. If I read this correctly, the BLS is saying that the used car price anomaly alone added something like 1.5% to April’s reported CPI.
Summary: The Headline Number is Too High This Month
The headline CPI for April is certainly overstated.
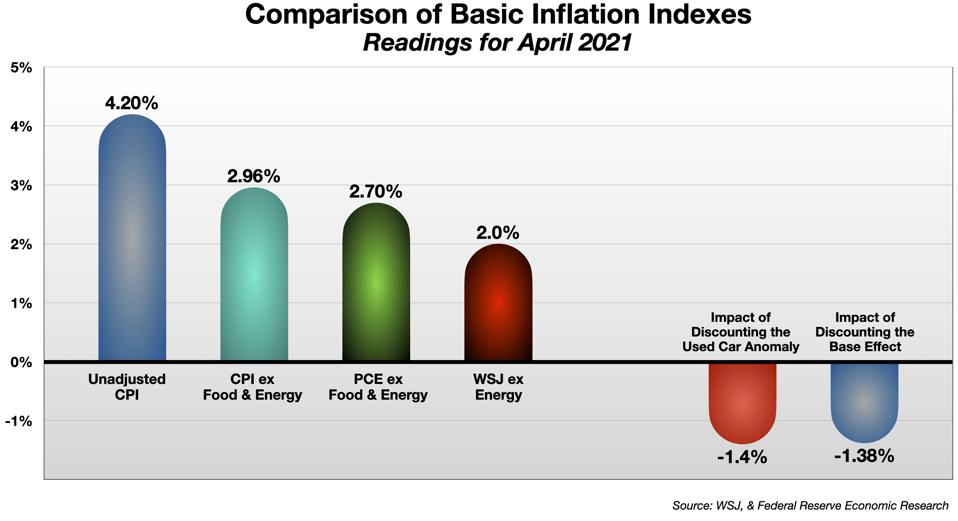
It is hard to say precisely how large the distortion is, but it is significant. Removing energy and food price volatility drops the inflation figure by 1.3%. Failure to discount the base effect would account for at least 1%. If we use the PCE instead of the CPI (as the Federal Reserve has recommended for years), that probably cuts the number by another 3/10ths of a point or so. The anomalous impact of energy prices and the used car prices, if corrected or discounted, would further reduce the level of “true” inflation — that is, price pressure that is structurally integral and likely to persist. The so-called “trimmed mean” version of the index – which excludes the price-change outliers (the largest increases and the largest decreases) won’t be out until the end of the month. In March, it “trimmed” about half a percent off the PCE.
These factors overlap to some extent, and of course one can always argue about the choice of metrics and assumptions. But all these reasonable adjustments point in the same direction right now. It may well be that a properly deconstructed/reconstructed view of inflation would bring the true value down to under 2% – which is where it has been for years.
This article originally appeared on Forbes.

