
Anyone spending enough time in the investing world will eventually come across annuities. It seems like there is an endless possibility of options from annuities, which is similar to investment choices that also have a barrage of choices. Annuities can be immediate or deferred - they can be fixed or variable. They can be single life, joint life or period certain.
They even have more complex fixed-index annuities that can be pegged to an index performance with participation rates and rate caps. Those are starting to get more into the investment field rather than an insurance product, however.
For simplicity's sake, we are going to be taking a look and comparing the more basic annuity. One that most individuals will probably be familiar with and is the fixed lifetime annuity. We will then weigh the pros and cons - then take a look at a basket of income-producing closed-end funds.
Annuity
The main benefit to a lifetime annuity is that the amount of monthly cash flow is basically guaranteed. Essentially there is no investment risk because you aren't investing in anything. That is, with a fixed lifetime annuity you aren't investing anything anyway. That is where a variable annuity can offer more options and where you can invest.
For an example of this, we can use Charles Schwab's "Income Annuity Estimator." We will use the single life only option, for a male individual that is 61 years old. We also are using a $100,000 investment and that we live in Michigan (my home state.) A 61-year-old means they are retiring early if we are to use the Social Security age of 67 for individuals born in 1960 or later.
Charles shows us that the monthly income would be estimated to be $452. This amount is if you select that there is no death benefit. Which is another important step to decide. In this case, with a smaller amount of only $100K - we are really only looking at $417 estimated for a single life with a cash refund. This means your beneficiaries will receive whatever portion of the cash wasn't paid out during your life - if any.
If we use the $452 amount that works out to an annual cash flow of $5,424. or around a 5.42% annually based on your $100K principal. It is important to note that this isn't an interest rate or a rate of return as it includes, essentially, your principal is paid back to you.
The one important thing here is that annuities are insurance products. They want you to give them money, and it is in their benefit to pay you as little as possible back. If you make a return, that means they have lost money. Though they still have to remain competitive due to other insurance companies also wanting your hard-earned capital.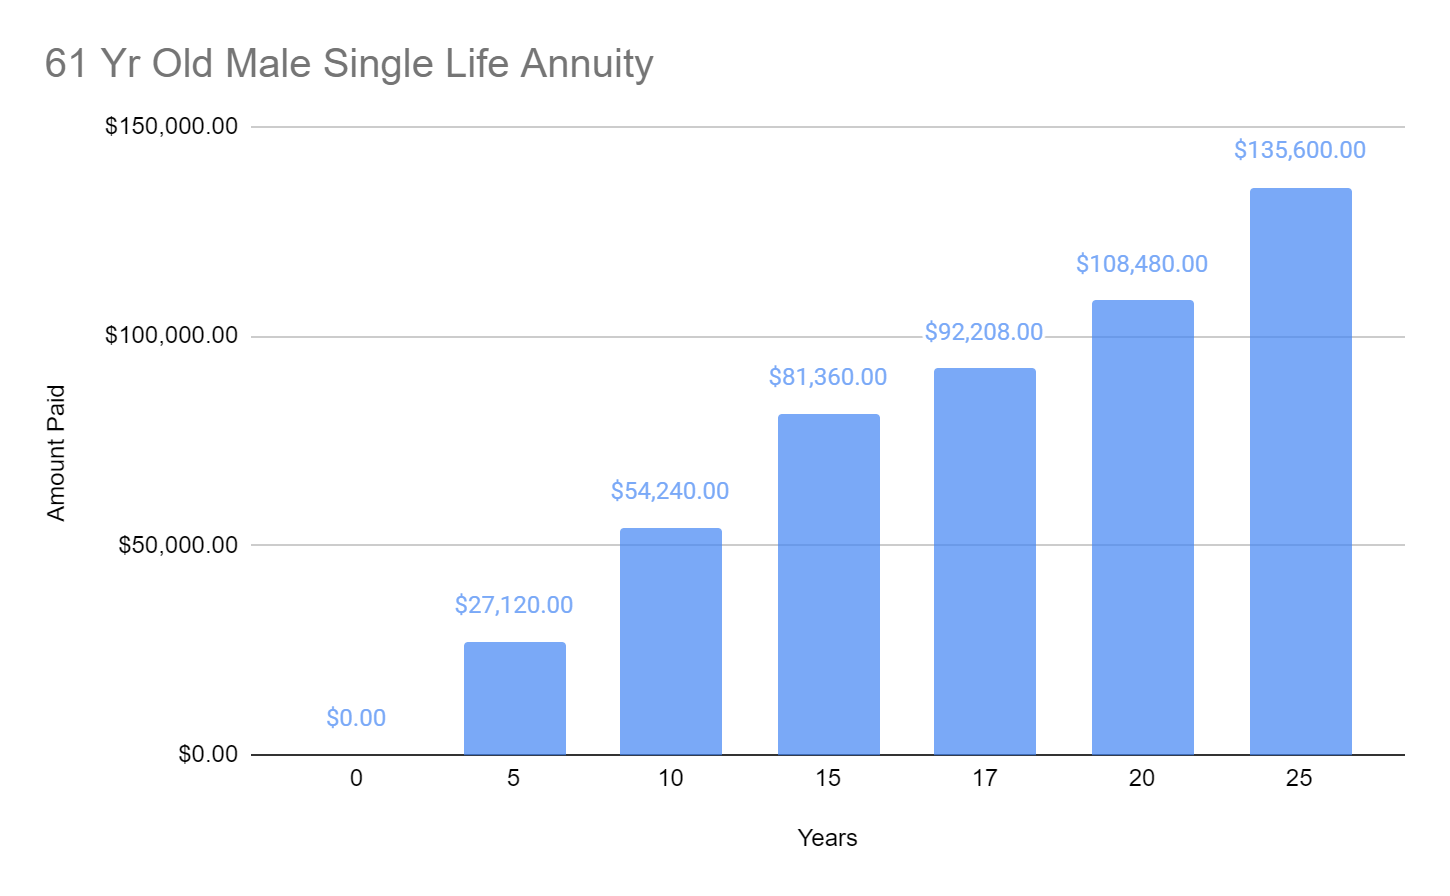 (Source - Author)
From the above, we are looking at the total amount paid out depending on the lifespan this individual would have lived. Remember, we put $100K in and there is no beneficiary benefit upon death. 17 years is included because the average U.S. life expectancy is 78.80 years. Though this was lower for individuals born in earlier years and males also live shorter lives.
However, again trying to illustrate the main point here this is sufficient. In fact, this will help out the annuity side considering that average life expectancies have now come up compared to those born in 1960.
What we can see is that even after 17 years that original $100K hasn't been recouped. Therefore, to see that principal come back and "earn" something you have to be around longer than the average life expectancy based on these figures. If you are incredibly unfortunate, you could walk away with nothing in return if you pass away before the first deposit is received. Hence, 0 years showing $0.
For our illustration above, let's say you do make it 25 years. That puts you at 86 years old which is a real possibility for most individuals. However, for all those years you have only "earned" $35,600 on your investment. That might not sound terrible when you figure that is a 35.6% return. Though annualized over 25 years you are looking at a return of ~1.42%.
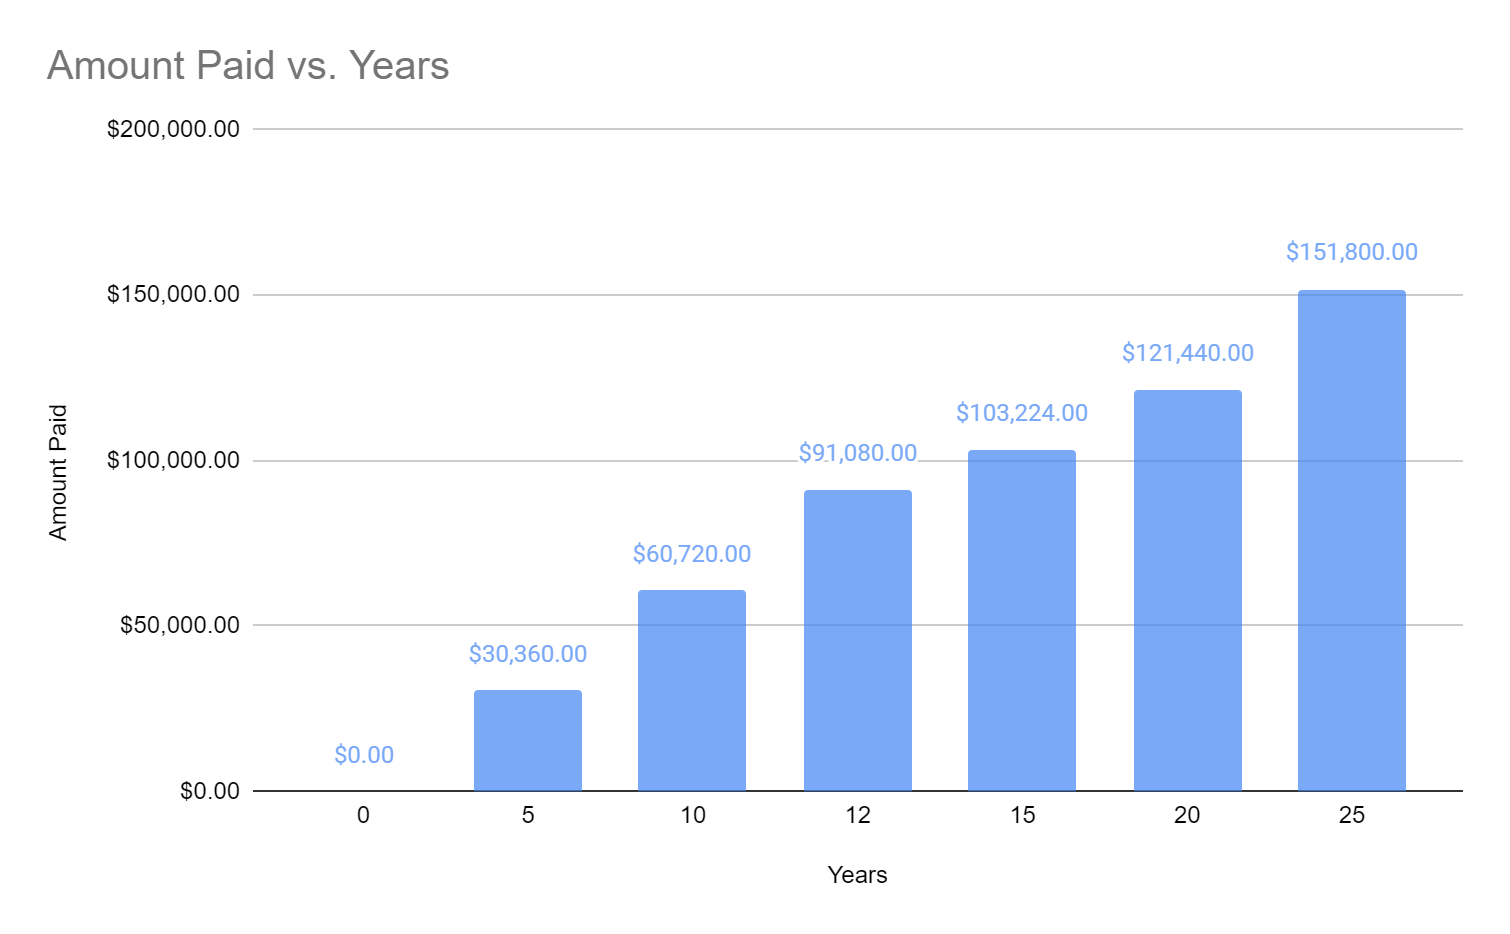
Now let's run the figures again. However, this time we are going to say that we were born in 1955, putting us at 66 years old. This time, we are going to see a higher monthly estimate. The rest has remained the same - $100K, single life, immediate annuity and a Michigan resident.
This time, since the insurance company is anticipating you'll pass away sooner than the 61-year-old - they'll pay you a monthly amount of $506. This works out to $6,072 annually.
(Source - Author)
Once again we see that even if you live to the average life expectancy of a U.S. resident born today, you would not recoup your initial investment by that age. Though after 15 years you would. That is opposed to the previous 18.44 years you would have had to live in our previous example.
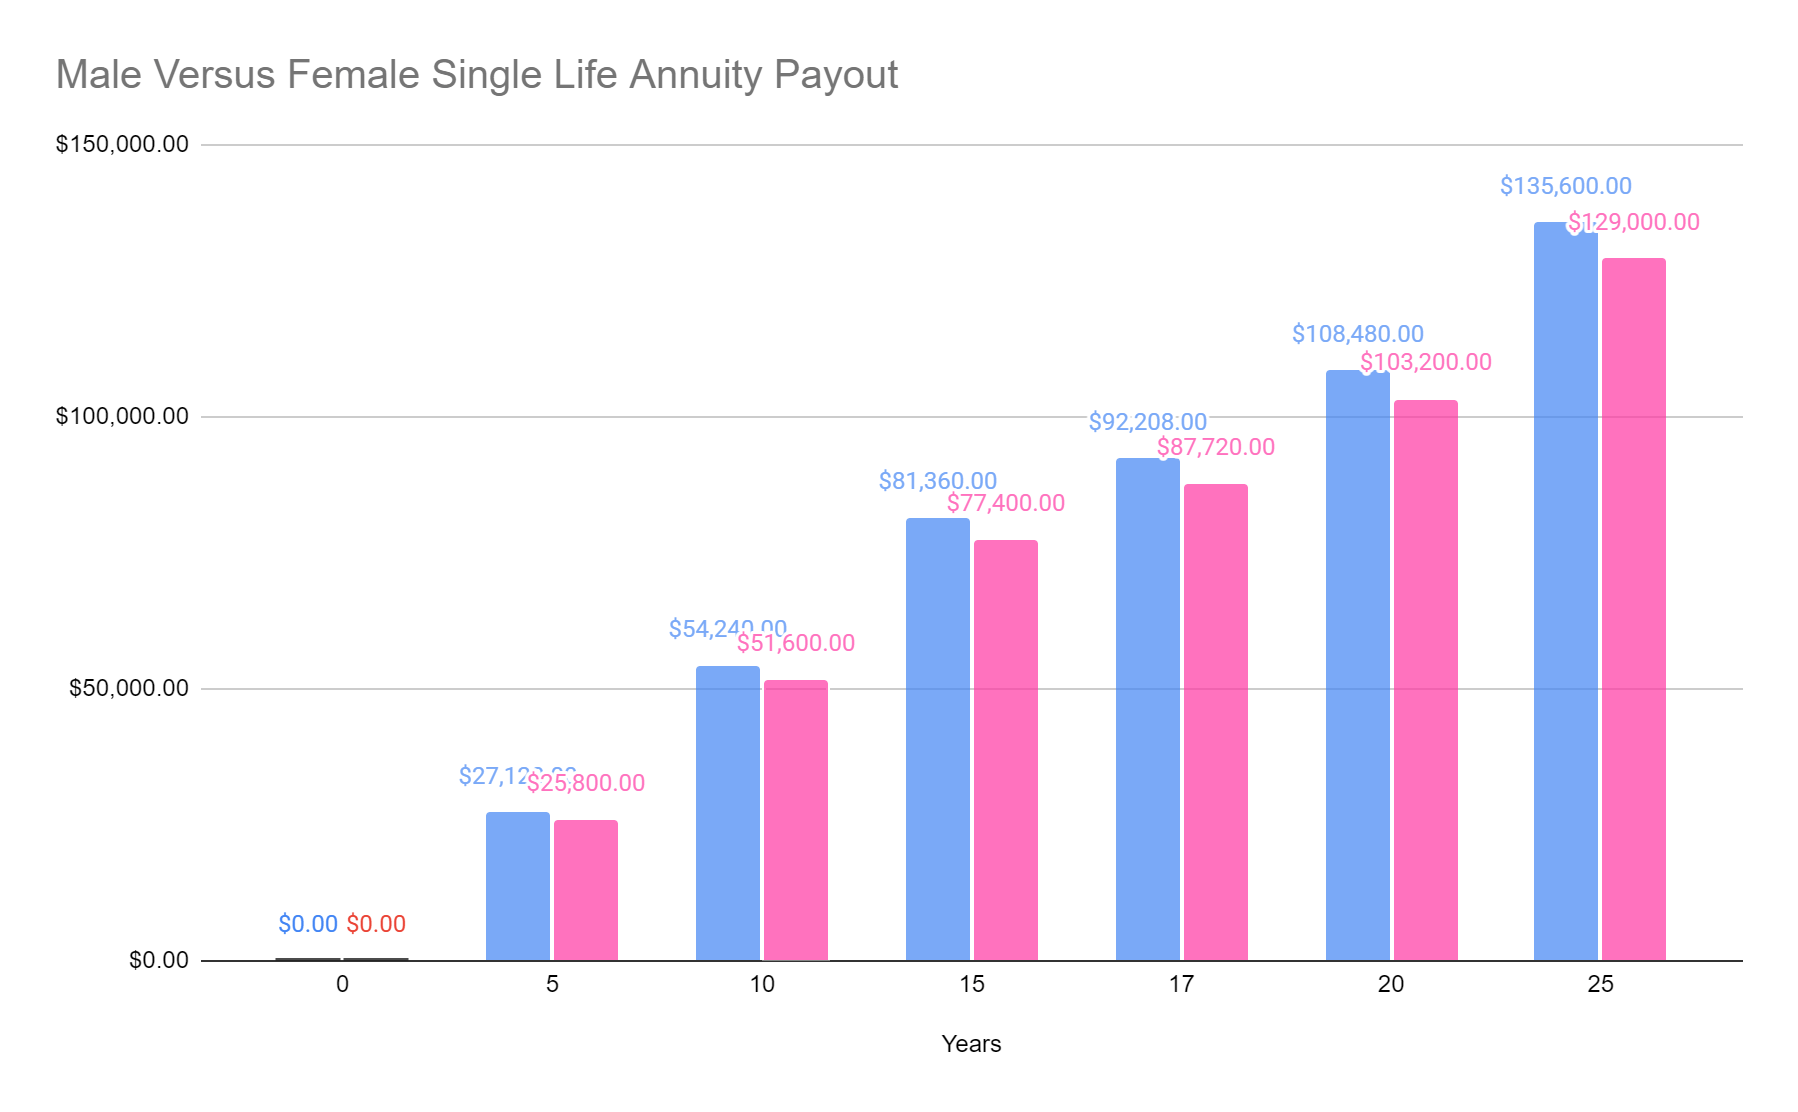
For ladies, it is worse since they are expected to live longer. If we run the same numbers that we did in our first example, Schwab says that a single life-only annuity will pay us $430 per month or $5,160 annually. Not a significant difference with the $100K example, but larger amounts would be more and more noticeable the higher it goes. It is also noticeable the further out the number of years goes.
(Source - Author)
There are many different types of annuities available out there. The above we went through detailed on immediate single life annuity. However, there are deferred fixed annuities available as well. They pay a fixed rate on the amount invested and can be set up for different periods of time. You don't receive income from these as it is "deferred." This can be an option for some individuals that want these guaranteed rates that are higher than CDs and high yield savings are offering lately. At this time, it seems like the going rate is around 3%. From what we will explore below, that is still quite a bit lower than what an investment portfolio would have been able to produce.
Closed-End Funds
Now, our goal is to come up with a portfolio that can beat what "returns" annuities can offer. This is actually quite easy, and we can do so by collecting a much higher monthly cash flow as well. The difficulty comes in selecting funds that don't have a lot of volatility.
The biggest difference here is going to be that CEFs are investments. They can and some will definitely lose money. So what we are going to be looking for primarily are funds that offer lower leverage. Though including some PIMCO names as they have offered "annuity-like" income streams with how steady their distributions have been historically on several of their funds.
We also know that CEFs can be more volatile overall due to premium/discount mechanics. The fact that the market price of the CEF often doesn't trade at the NAV price of the underlying investments.
For our CEF portfolio that we are going to construct we are going to be using Portfolio Visualizer. This will only be a backtest. Again, stressing that there is obviously investment risk in CEFs, whereas a single-life annuity is not going to have that risk.
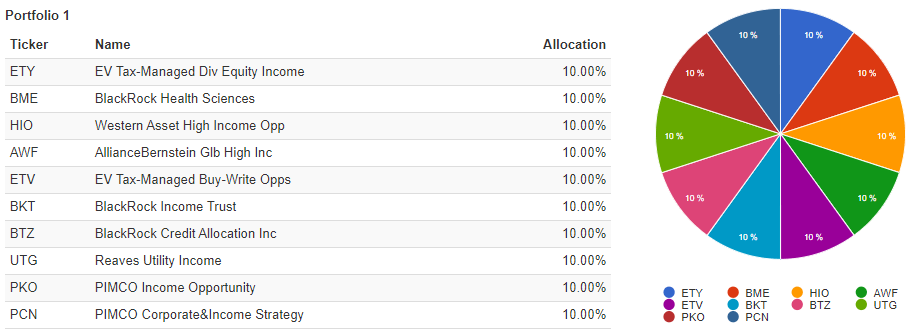
We will once again be using the $100K investment amount and select 10 funds that have consistent distributions historically.
The portfolio that I came up with for example I made sure to all have inception dates pre-2007/08. Of course, this was a critical time and will give us our maximum drawdown for the portfolio.
(Source - Portfolio Visualizer)
Here is the portfolio and I went with an equal-weight across 10 different funds. I sorted them so the first 5 have no or minimal leverage. The bottom 5 funds do have leverage but have been consistent dividend payers since their inception.
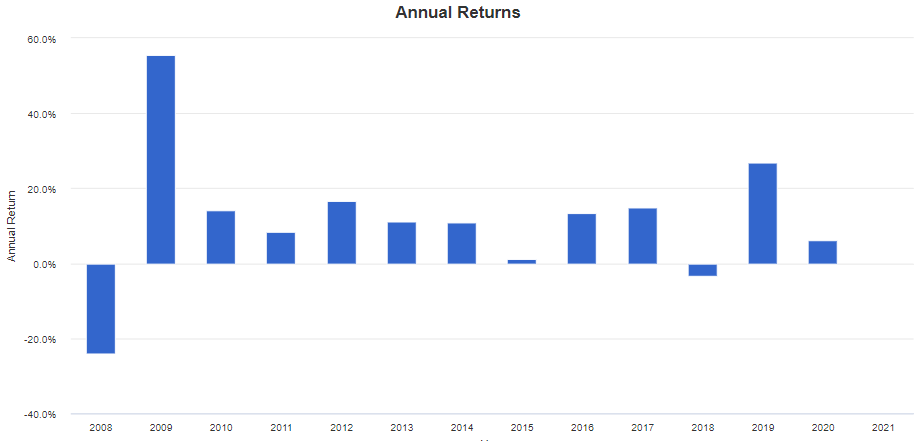
The maximum drawdown does come in the year 2008, as expected. For last year's market selloff in 2020, the maximum drawdown came to around 20%.
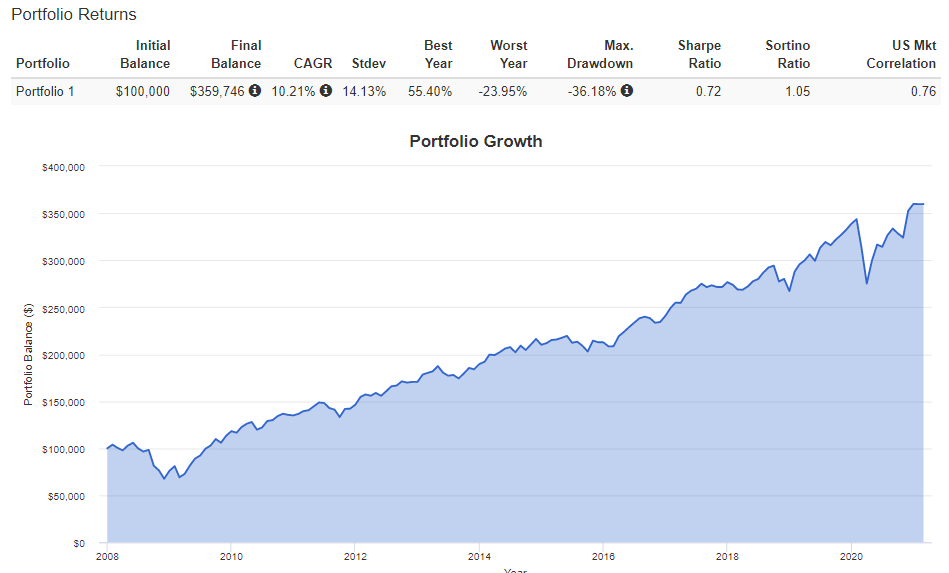
(Source - Portfolio Visualizer)
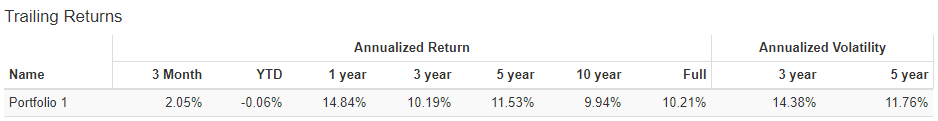
The chart goes back as far as PIMCO Income Opportunity Fund's (PKO) inception in 2007. For the annualized returns, this portfolio has fared well. Though this was also in a period of a mostly bull market for equities and bonds too, so that should be factored. The truth is no one knows for an absolute what returns will be like going forward.
(Source - Portfolio Visualizer)
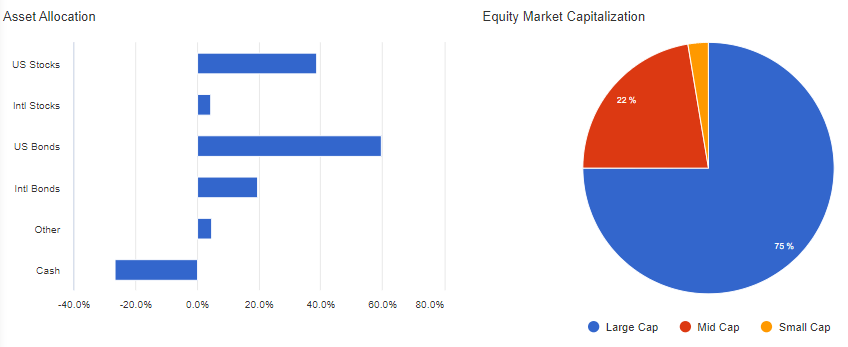
With this portfolio, we are leaning hard into a U.S. allocation of large-cap type investments according to the breakdown. We can see below that the cash amount is well into the negative figures assuming the leverage on the portfolio we constructed.
(Source - Portfolio Visualizer)
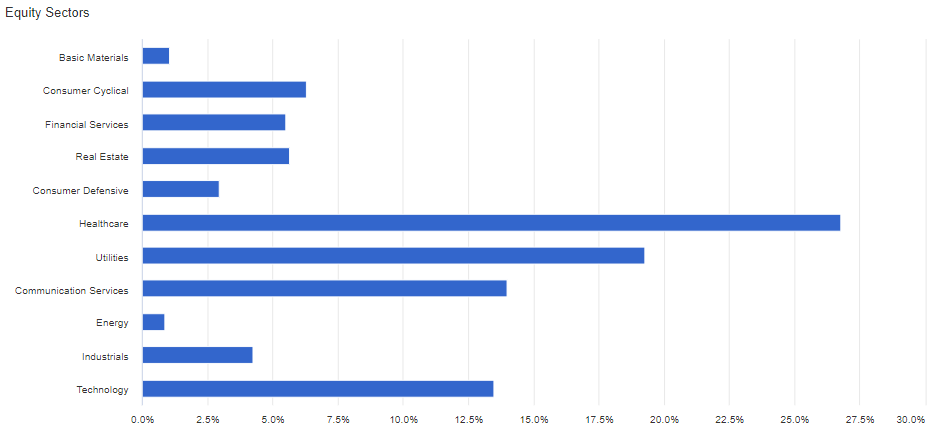
The sector breakdown of the equity portion of the portfolio does put us heaviest in healthcare. That is thanks to the BlackRock Health Sciences (BME) holding. A solid holding that has never cut its distribution since its inception in 2005.
We also have utilities at a fairly large allocation. This would be due to the also very solid fund; Reaves Utility Income Fund (UTG). That fund has likewise never cut its distribution since its inception either.
Tech and communication services are also carrying a meaningful exposure as well. This would be through the option-based equity funds; Eaton Vance Tax-Managed Diversified Equity Income (ETY) and Eaton Vance Tax-Managed Buy-Write Opportunity (ETV).
(Source - Portfolio Visualizer)
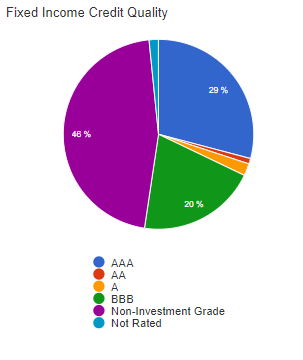
Finally, we have the breakdown of credit quality for the fixed-income portion of the portfolio. We see that it is pretty fairly split between investment grade and "junk." Utilizing funds like BlackRock Income Trust (BKT) and their agency MBS is going to give us quite a bit of exposure to AAA-rated securities.
On the opposite side of the credit quality spectrum, we have the AllianceBernstein Global High Income Fund (AWF) and Western High Income Opportunity (HIO). Though AWF is high-yield, the fund doesn't utilize a lot of leverage. HIO utilizes no leverage.
BlackRock Credit Allocation Income Trust (BTZ) is also going to give us a pretty healthy mixture of various credit qualities up and down the spectrum as well. That is along with funds like PIMCO Income Opportunity (PKO) and PIMCO Corporate & Income Strategies (PCN) that also offer a multi-sector bond exposure. Though the PIMCO funds have never cut their distributions, they carry a large amount of leverage and that is worth noting.
 (Source - Portfolio Visualizer)
Just as the investments of these funds fluctuate due to the value of the underlying portfolios - income also can fluctuate over the years. While trying to put together this mini portfolio that could take on the likes of an annuity, there was still some variance over the years. Specifically tied to the 2008 events that rocked several of these funds as it took the markets a while to recover more broadly as well. This is especially true as many of these CEFs have paid out year-end special dividends as well. That caused even more fluctuation - though should be seen as a positive.
For comparing the distributions paid now versus then, I am looking at what $10k invested on 01/01/2008 would have translated into for each of the funds. Then comparing with what the funds paid out last year on the same number of shares as if an investor had bought these funds in 2008 and then held them all the way through last year. I hope this helps make a fair comparison of what the funds would have been providing in cash flow for a period of time of over a decade.
| Ticker | Shares | Distribution Amount 2008 | Distribution Total | Distribution Amount 2020 |
Distribution Total |
| ETY | 599 | $1.85 | $1,108.15 | $1.01 | $605.95 |
| BME | 370 | $1.71 | $632.22 | $2.40 | $888.00 |
| HIO | 1650 | $0.58 | $950.40 | $0.39 | $641.85 |
| AWF | 793 | $1.42 | $1,128.44 | $0.79 | $623.30 |
| ETV | 587 | $1.89 | $1,106.85 | $1.33 | $780.48 |
| BKT | 1642 | $0.29 | $472.90 | $0.41 | $677.82 |
| BTZ | 573 | $1.67 | $954.05 | $1.01 | $576.90 |
| UTG | 400 | $1.48 | $590.40 | $2.16 | $864.00 |
| PKO | 399 | $2.12 | $847.48 | $2.28 | $909.72 |
| PCN | 759 | $1.28 | $967.73 | $1.35 | $1,024.65 |
| Total | $14.27 | $8,758.60 | $13.13 | $7,592.66 |
(Source - CEFConnect, Seeking Alpha - Author Compiled)
What we can see is that income from 2008 to 2009 would have declined. The annual cash flow would have been down around 13.3% from 2008 to 2020. In which case, that would not have been the case if an individual went with an annuity.
Despite this, we would have still netted positive returns as we explored above with the annualized return figures. In fact, it wouldn't have taken much time after 2008 for the portfolio we modeled to recoup those losses and start making investor returns.
(Source - Portfolio Visualizer)
That is in contrast to an annuity, where you don't ultimately end up seeing a return for many years down the road - if you live long enough to get there.
Conclusion
At first, it might seem a bit unusual to try to compare annuities and closed-end funds. Since they are quite different on the surface. One is just about guaranteed monthly cash flow and the other is an investment. However, both can be utilized to achieve the same thing. That is to provide monthly income to an investor.
With annuities, you can't say absolutely guaranteed because it could be possible that the company offering you the annuity fails. States step up and fill some of the losses, though not in an unlimited amount.
Even though I find investing in closed-end funds more preferable, the purpose of this article wasn't necessarily to sway an individual one way or another. It was to lay out the figures using estimates and historical data that we could dig up. An individual looking at annuities is going to have the benefit of monthly cash flow that is unchanged for their life if they choose that option.
An investor in closed-end funds - while taking more risks - will have a much better chance of earning a return over a period of time. Whereas an annuity these days you might not ever see a return depending on your life span. Though even in our example of solid funds the income had declined from 2008 to 2020.
That decline could have easily been offset if an investor would have reinvested even a small portion of their income stream back into this portfolio. I could have even just cherry-picked funds I knew that never cut their distributions since then and only included those. I wanted to come up with a type of diversified portfolio that one might put together in today's environment though. Not something that could just be handcrafted with historical information.
This article originally appeared on Seeking Alpha.

