
(DataDrivenInvestor) - If you are feeling frustrated with stock picking lately, you are not alone.
The Investment Pros (the active fund managers) as a group cannot do it!
Evidence against Stock Picking
The lack of consistency in active managers’ performance against their respective benchmarks has been well-documented. Mentioned in IFA’s article based on the 2021 S&P Indices Versus Active (SPIVA) scorecards:
SPIVA found that more than 95% of all domestic active stock fund managers had underperformed their respective S&P benchmarks in the past 20-year period through 2021. In U.S. small caps, nearly 94% of active fund managers lagged the S&P SmallCap 600 benchmark.
Even active management’s record in foreign markets over the past 20 years raised red flags. Inquisitive investors might take note that almost 93% of international stock fund managers weren’t able to beat their respective S&P indexes.
Stock picking has become very difficult as the internet, technology, big data, and algorithmic trading allow information to be shared efficiently and any “mispricings” being arbitraged away instantly.
Worse yet, stocks are subject to event risks — unexpected events that cause a big loss in a company’s stock or bond price. Witness April’s Netflix 35% plunge after they announced subscribers loss in their Q1 2022 earnings report.
Vanguard, the index fund giant, said in its Global Case for Strategic Asset Allocation:
On average, active management has reduced a portfolio’s returns and increased its volatility compared to a static index-based implementation of the portfolio’s asset allocation policy.
The Rise of Passive Investing
While active investing means selecting stocks with the goal of outperforming the market, passive investing refers to simply holding the entire market or an index such as the S&P 500 Index via Index Funds or Exchange-Traded Funds (ETFs). In other words, you are holding a basket of stocks in the same proportion of the underlying index, and you are not picking any particular securities.
Active fund managers have underperformed the market after fees. The cost of passive investing in the form of index equity ETFs was on average 16bp (0.16%) at the end of 2021 compared to 47bp for actively-managed equity mutual funds. By the end of 2021, index funds have overtaken actively managed funds’ ownership of the US stock market for the first time.

Buy the Market or Index
We have established buying the market via index investing (either index funds or ETFs) is much more efficient, increases diversification, and saves money.
The question is which market and which country should we invest in — domestic, international (developed), or emerging markets?
If I tell you in the past 5 years — one of the most volatile and eventful 5-year periods in recent market history — the difference between the best stock market returns and the worst in U.S. dollar terms (based on the world’s top 50 countries market capitalization) averages about 60% each year, will you believe me?
Here are the numbers:
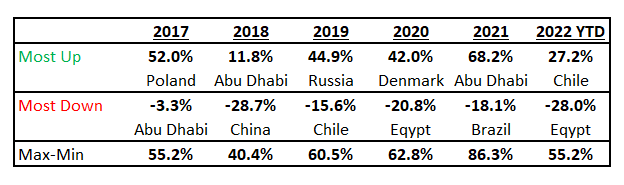
It is almost certain that no one can pick the best-performing stock market and avoid the worst every single year.
It pays to know what to look out for when deciding which country to invest in, much like when you are analyzing a company stock.
Evaluate country by country rather than invest in the entire emerging markets or developed markets. In the case of an emerging markets ETF, such as the EEM (ticker), one country, China, represents 30% of the entire ETF.
Five Things To Consider When Evaluating Countries in Index Investing
- Stock market structure
- Economic structure and drivers
- Policy mix — expansionary or contractionary
- Debt burden and debt-servicing capability
- Valuations
(1) Understand the stock market structure: the composition of the stock market by sectors and their weights in the equity indices.
Here are three major stock markets: if you buy an index fund that holds the S&P500 Index (SPX), you are holding 26% in technology stocks but only 2.4% in materials stocks.
In contrast, if you buy the U.K. market (UKX) or an ETF that mimics the UKX, you are likely holding 1.4% in technology stocks but as much as 17.8% in financials. In the domestic China-A shares market (CSI300), financials are even higher at 30.1% while the smallest sectors are communication services and real estate at 1.7% each.

(2) Identify the structure of the economy: what drives the country’s economic growth (GDP)? How open is the economy? What does the country import and export? Just like we evaluate a company’s revenue growth, we should know the sources of growth for the economy.
A. Economic growth: Gross Domestic Product (GDP) consists of 4 components: private/household consumption, government expenditure, investments, and net exports (exports minus imports).
For example, in 2021 in the U.S., personal consumption made up almost 70% of GDP, making the U.S. a very large consumer-driven economy. The country is well-known as a consumption nation. Check the net exports — it was at -4%, meaning the U.S. imports value exceeded the exports value by 4% of GDP!
In contrast with Germany, personal consumption was 50% of GDP while investments were larger at 23% (vs. 18% in the U.S.). It runs a current account surplus — the net exports were at +5% of GDP!
When consumers stop or slow their spending, U.S. economic growth suffers a great deal while Germany’s exports, government spending, investments, and trade play a bigger role in driving its economy.
Germany is also a more open economy than the U.S.
B. Openness of the economy: it is the exports plus imports (total trade) as a % of GDP and is a measure of how integrated the economy is with the rest of the world.
You can check out the data here. Economies such as Hong Kong and Singapore are banking centres and are fully integrated with the rest of the world. They both have a very high trade % of GDP (over 300%).
Sorting by value from highest to lowest and scrolling to the bottom of the list, you can see the U.S. at only 23% of GDP! Obviously, the U.S. trades with the rest of the world, but the bigger driver of its economic growth is not external trade but domestic consumption.
C. Is the country a net exporter of food and fuel? In the current inflationary environment and heightened food crises, it makes a difference if the country is a net importer or exporter of energy or food. See how different the countries fare in this interactive graphic here based on the World Bank database.
For example, apart from Norway, all major developed European countries are net importers of fuel. With oil and gas prices approaching a record high at the time of writing, these European countries’ inflation rates went through the roof and their economic growth dampened.
(3) Policy mix — expansionary or contractionary: policy mix is the combination of the monetary and fiscal policies (macroeconomic policies) that are carried out by the Monetary Authorities like the U.S. Federal Reserve (monetary) and the government (fiscal) to strengthen or stabilize an economy during an economic crisis.
At the beginning of the COVID-19 crisis, many governments used a combination of expansionary monetary and fiscal policies to buffer the economic shock. For example, the U.S. pumped liquidity into the economy by lowering and keeping the interest rates at zero and using Quantitative Easing. It also opened its fiscal chest by sending stimulus checks to the citizens and enacting targeted policies to assist various economic groups.
The rapid rise in liquidity has fuelled the sharp stock market recovery in 2020, so paying attention to changes in financial conditions and liquidity caused by moves in macro policies is very important.
The following map from the Council on Foreign Relations shows which country is loosening or tightening monetary policy, and you can see the divergence. The Americas are tightening (red) but most of the rest of the world are loosening (blue).

You may be wondering at this point, what about the exchange rate fluctuation when we invest internationally, and what causes these fluctuations?
The local currency can strengthen or weaken via (1) the changes in monetary and/or fiscal policies and/or (2) the exchange rate policy.
One example of how monetary policy can impact the exchange rate is the decline of the Euro towards parity with the U.S. Dollar since 2021. The Federal Reserve started raising interest rates in March this year while the European Central Bank has just announced a rate hike intention for July for the first time in 11 years. The rising U.S. rates versus the stagnant Euro interest rates have strengthened the dollar against the Euro.
The tightening of U.S. liquidity has particularly affected stock market performances because of more uncertainties for the companies’ future cash flow. A rising discount rate also brings down the net present value of the future cashflow — think of the stock market as a discounting machine.
(4) Debt burden and debt-servicing capabilities: here we are referring to the total debt (government, corporation, household) as a percentage of GDP (debt burden) and the total principal payments and interest expenses of a country to its exports earnings (debt-service ratio).
The higher the debt burden and the lower the debt-servicing ratio, the riskier the country is from a repayment point of view.
From the IMF blog post, “Dangerous Global Debt Burden Requires Decisive Cooperation”, you can see the jump in the total debt in each type of economy in 2020 when many governments ran larger fiscal deficits and accumulated debt much faster as a result of the economic slump.
The developed economies have recovered relatively faster than many of the developing economies which are suffering from economic slowdown, food and energy crises, and the rising costs of capital — a triple whammy for emerging markets!

(5) Valuations: this is probably the most important factor when deciding whether to invest or not. We should be looking for a large margin of safety (price below the intrinsic value) as Benjamin Graham, the “Father of Security Analysis”, taught us.
Here are some useful valuation metrics and considerations:
A. Return on Equity (ROE) vs. Price to Book (P/B): The graph below plots the ROE, a measure of profitability, versus the P/B ratio, a valuation measure. While there is no fixed relationship between the two, in general, you want to invest in a country above the line. Corresponding to each multiple, you would like the country ROE to be as high as possible.

B. Economic growth does not guarantee stock market performance: earlier, we discussed the economic growth rate of a country, and you will think that the faster the economic growth, the higher the equity index return will be. It depends on the starting valuation!
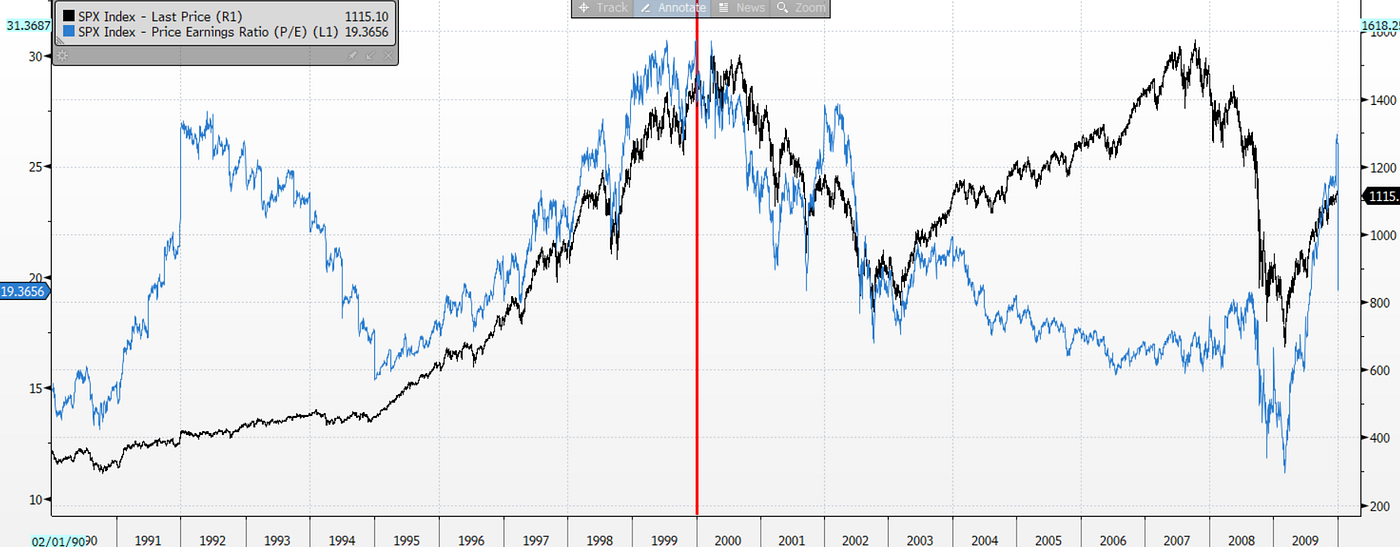
The graph below shows the price of the S&P500 Index (black line) and the price-to-earnings ratio of the same index (blue) from January 1990 to December 2009.
The average real U.S. economic growth rate of the 1990s was 3.2% compared to 2.8% for the next 7 years before the onset of the Great Recession.
However, the SPX Index (black) to the left of the dividing red line surged while the SPX Index went nowhere since the end of 1999 and in fact plunged in 2008–2009.
Why? The starting valuation matters.
(C ) Intrinsic valuation of the market as measured by the implied cost of capital. At our firm, we have derived the expected returns the market has priced in (the IRR or the discount rate) for asset classes, countries, sectors, and ETFs down to individual securities. This is a universal, objective, and forward-looking measure of value (while market multiples are technically momentum indicators) and can be used to compare relative valuation across equities and bonds.
Takeaways:
Country analysis includes many similar elements to company analysis. In my view, country analysis is a lot of fun when you integrate a broad set of macro parameters into your decision.
When investing in a country via index funds or ETFs, you are considering these factors:
(1) Structure of the stock market and the economy: know what the heaviest exposures of sectors/industries and the economic growth drivers are. Look carefully into the compositions of the country Index Fund or ETF.
(2) Source of earnings: apart from knowing the economic drivers (the components of the GDP), you can identify what the country imports and exports, what their competitive advantages are, and how they fare against an energy/food crisis or boom.
(3) Macroeconomic policies (policy mix): the trajectory of the monetary and fiscal policies. How they impact the aggregate demand and the exchange rate will have a major impact on the liquidity of the stock market and therefore the market returns.
(4) Leverage or debt burden of a country: is the country so debt-laden that it can no longer service its debt (local and foreign), especially when interest rates rise or its currency devalues? What is the trend of the country’s debt?
(5) Valuations: multiples and intrinsic valuation compared to their profitability (ROE), and margin of safety. Investing is a relative value exercise. You are always thinking of the opportunity cost of investing in one versus another.
Thank you for reading. If you are interested in other of my investment writings, please take a look at this collection:
Epilogue: I started my buy-side investment career in the mid-1990s as an emerging market fixed income analyst in an international mutual fund company right after my MBA graduation and became a CFA. Since then I have been a keen student of the market.
By Marianne O
June 14, 2022

