
(Kostya Etus CFA, Dynamic Investment Management Head of Strategy) Not much has changed in the last few months that we haven’t already seen earlier the year: The Fed continues to raise interest rates, inflation remains high, recession risks are on the horizon, the Ukraine conflict remains, COVID drives supply issues from China and recently, we political uncertainty was added around mid-term elections. Bottom line: Market volatility persists going into year end.
Market volatility and uncertainty can persist for some time to come, but volatility doesn’t mean the market will ultimately be falling. Volatility goes both ways: up and down. Over the long-term, the market has proven to be resilient, but the short-term noise can be a dangerous time for investors who are nervous about the future.
What history has shown is that the future is hard to predict, even for fortune tellers. And the best results come from staying calm and collected and riding out the storm. One of the most dangerous things that investors can do it try to time the markets. Here, we review some of the reasons why market timing is so hard and why staying invested and focusing on the long-term may be a better strategy.
Key Takeaways:
- You can't avoid the bad days and only participate in the good. The best chances of success are to remain invested in the periods of high volatility.
- While market performance this year looks bad, the picture changes when we take a step back and look at a longer view.
- As opposed to trying to time the market, staying balanced and diversified helps to smooth out returns, particularly during periods of market stress.
Why is timing the market difficult?
Primarily, market timing is difficult because you have to get it right twice! Once on the way out, and then again on the way in. It’s hard enough to get one of those right; the probability of getting them both right isn’t in favor of the investor.
As we saw post the COVID crash of 2020, the market can have a very quick snap back. If you miss out on any of that rebound, you could be locking in the losses and deteriorating your long-term returns, which could be a detriment to your lifelong investment goals. The chart below, “Time ‘In the Market’ is More Important than ‘Timing the Market,’”shows the potential impact of not being invested in the market for various periods of time. Key points:
- If you stay invested for the 20-year period (2002-2021), your return is close to 10% per year.
- If you tried to time the market and missed out on the 10 best days, the annual return was almost cut in half.
- If you missed about a month of top days (30), you essentially returned nothing.
Time ‘In the Market’ Is More Important than ‘Timing the Market’
Annualized Return S&P 500 Index (Total Return)
2002-2021
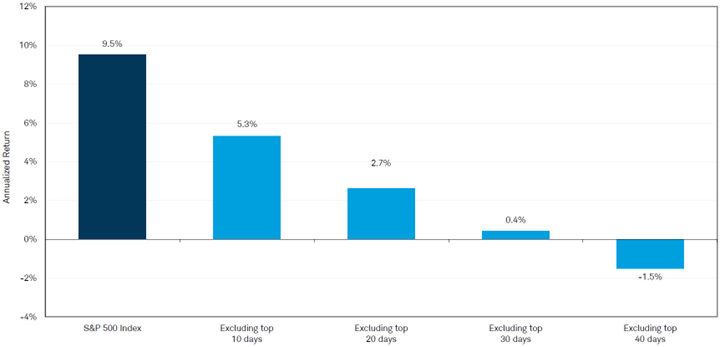
Source: Charles Schwab Quarterly Chartbook Q3 2022. Bloomberg as of 12/31/2021. Indexes are unmanaged, do not incur fees or expenses, and cannot be invested in directly. Past performance is no guarantee of future results.
The most interesting, and hardest to overcome, concept around market timing is that the best days often happen within weeks, or even days, of the worst days. The next chart, “The Best and Worst Trading Days Happen Close Together,” reinforces the following key points:
- Most of the best days cluster around the worst days.
- About half of the best days happen in years with negative returns (and many during a bear market or recession).
- You can’t avoid the bad days and only participate in the good; the best chance of success is to remain invested in the market, even during periods of high volatility.
The Best and Worst Trading Days Happen Close Together
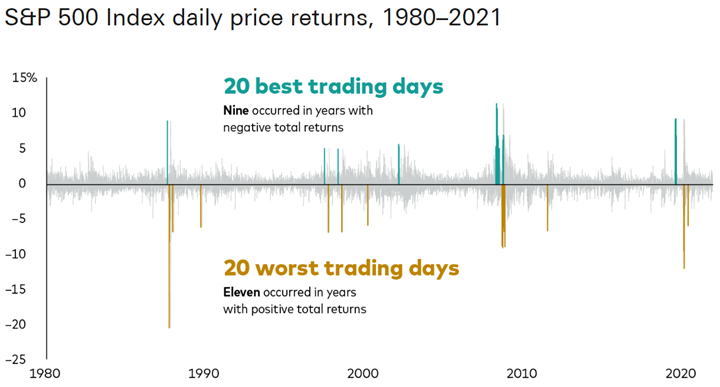
Source: Vanguard calculations using data from Refinitiv as of 12/ 31/2021. Past performance information is given for illustrative purposes only and should not be relied upon as, and is not, an indication of future performance.
See the Forest, Not the Trees
It’s easy to get overwhelmed in periods of market stress and investors start to question whether they should even be invested in the stock market. But what if we look at the stock market over the long-term? After all, most investors have a relatively long investment time-horizon. This long-term view certainly paints a different picture
While market performance this year looks bad, does the picture change when we take a step back and look at a broader view? We don’t have to go back decades, just three years. Key points:
- Looking at the chart below, “The Trees,” the stock market is in correction territory this year, down more than 10% and has generally trended down—not exactly a pretty picture.
- We zoom out with the second chart, “The Forest,” and notice that we’re currently at the same level where we were about halfway through 2021. So, we have simply given back some of what we earned last year.
- Lastly, let’s not forget that 2020 was actually a pretty good year for the market despite the COVID crash. Add it all together and we are up close to 30%—a great looking picture!
THE TREES
S&P 500 YTD 2022 Return through Nov. 30, 2022 (-13.10%)
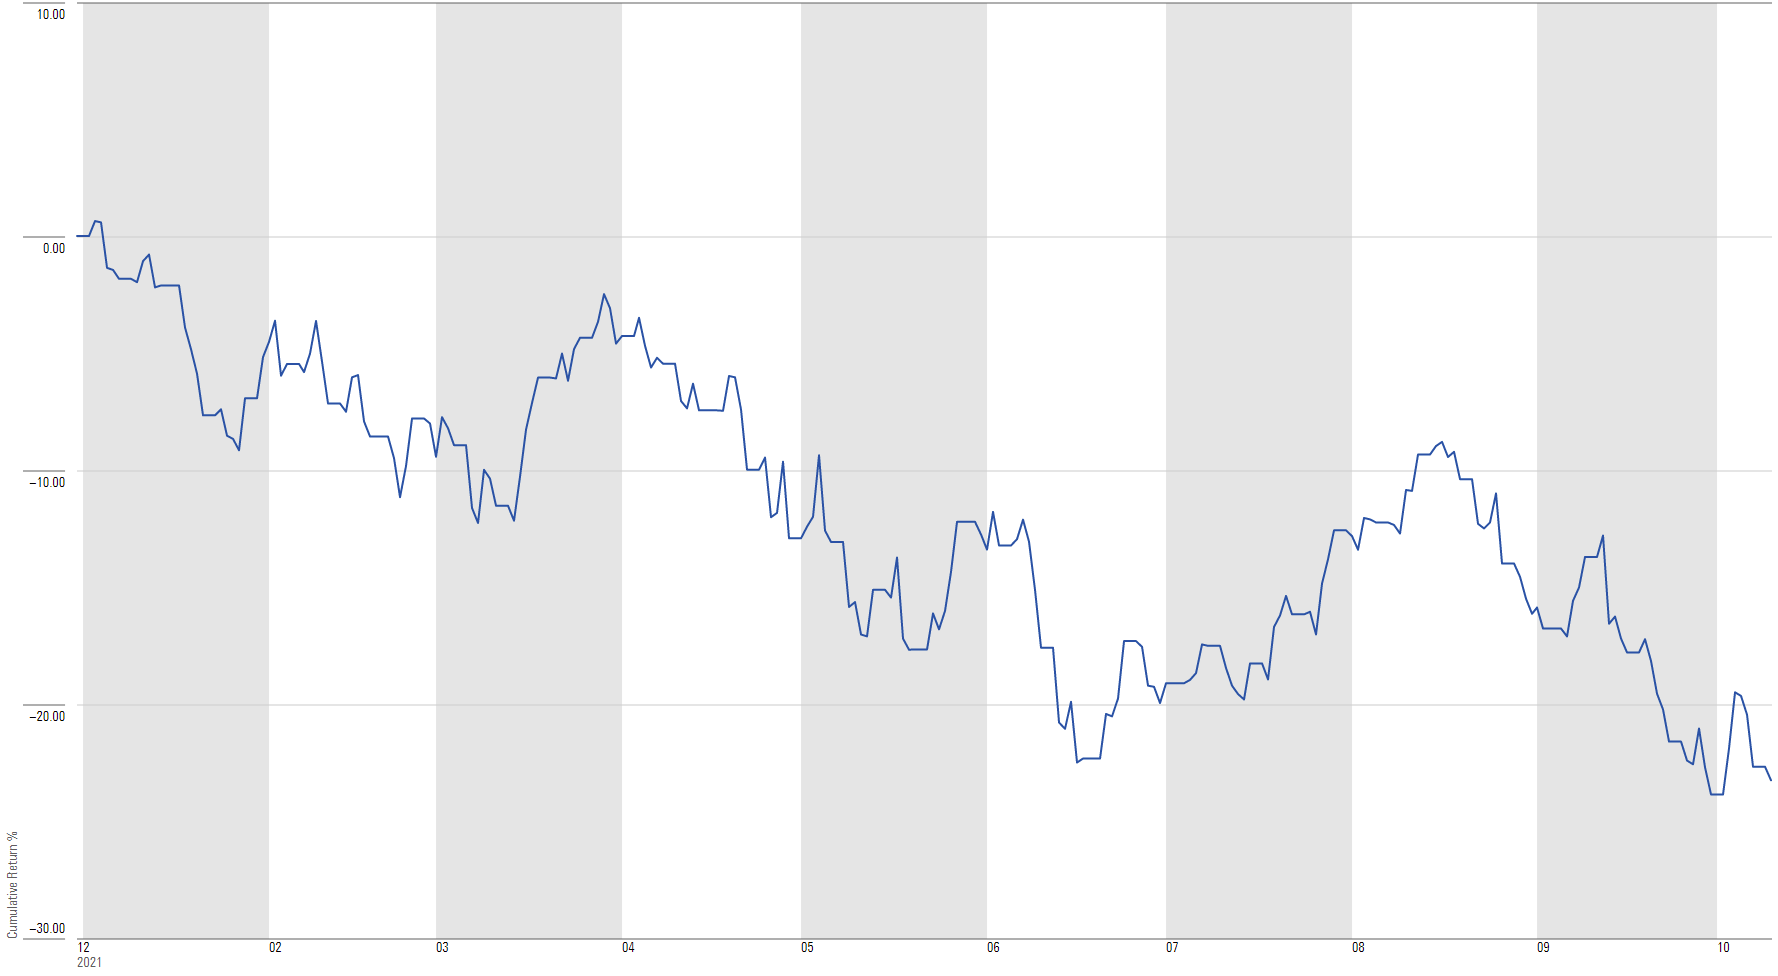 Source: Morningstar Direct. S&P 500 TR USD 01/01/2022-11/30/2022. Past performance is no guarantee of future results.
THE FOREST
S&P 500 3-Year Return through Nov. 30, 2022 (+29.13%)
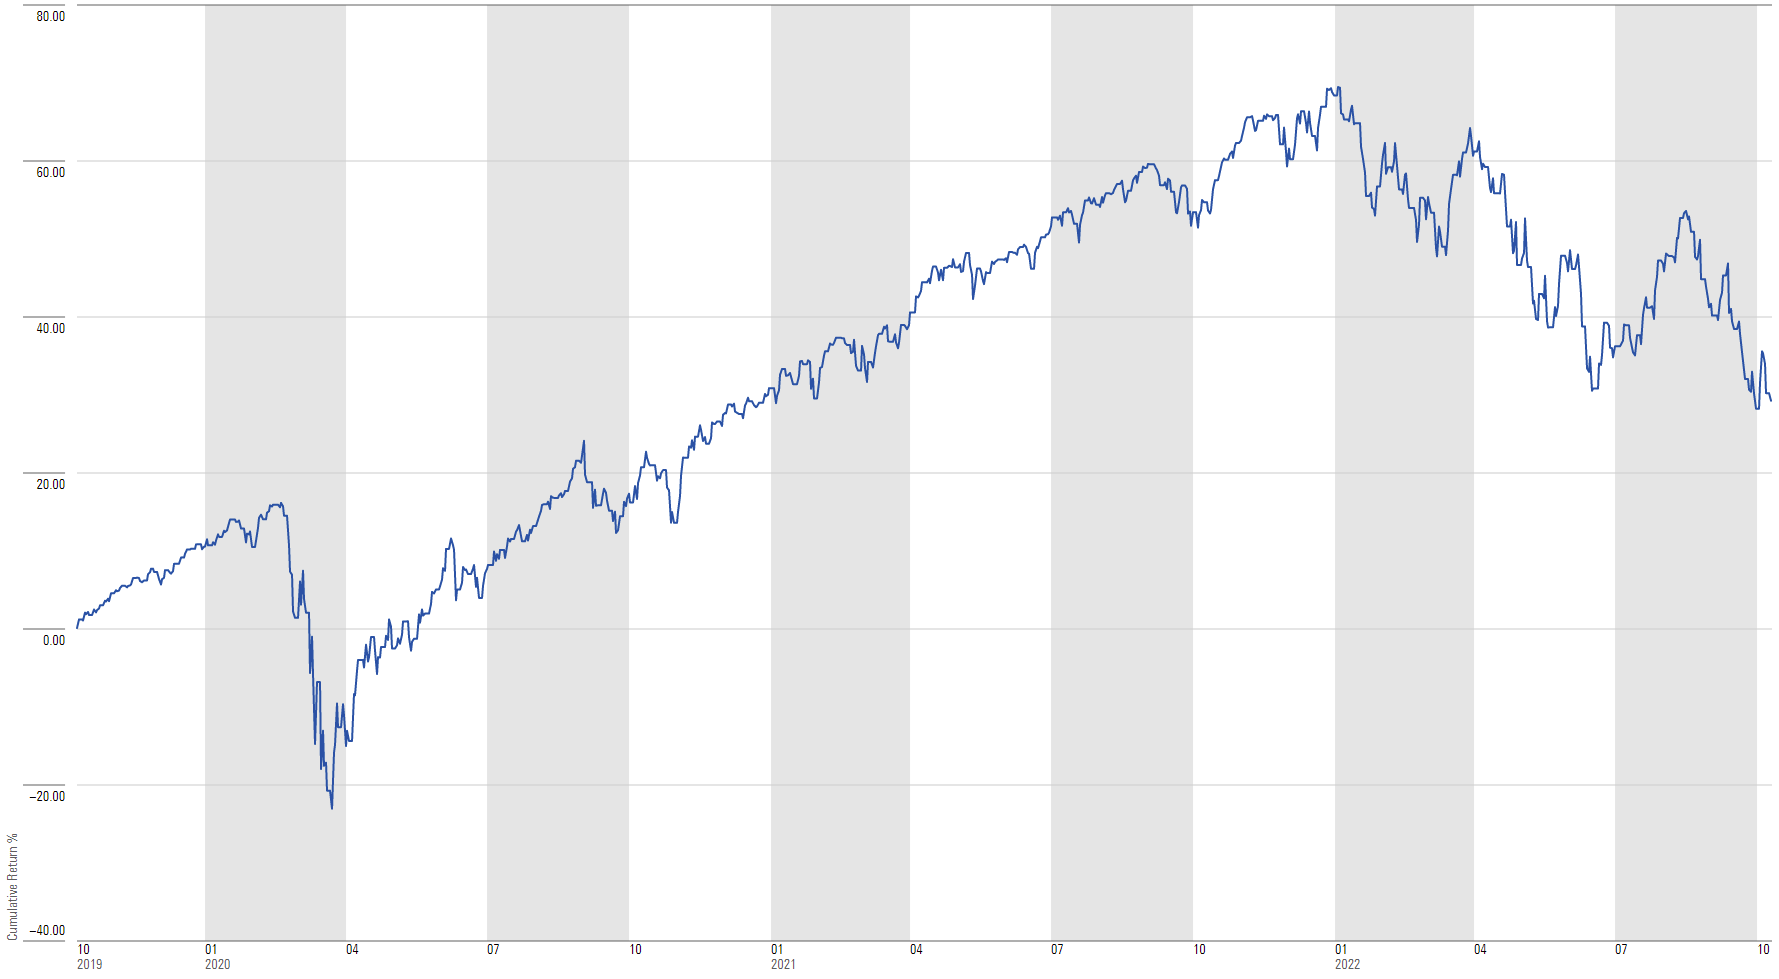 Source: Morningstar Direct. S&P 500 TR USD 12/01/2019-11/30/2022. Past performance is no guarantee of future results.
If Everything in Your Portfolio is Working, You’re Not Diversified!
It may be painful to see certain investments fall in your portfolio while others experience relative outperformance, but it’s not necessarily a bad thing. However, chasing performance (selling losers and buying winners) may not be the best strategy.
When it comes to investing, there are things we can control and things we can’t. We can’t control what the stock market will do, nor can we predict it. But we can control how diversified our investment portfolios are.
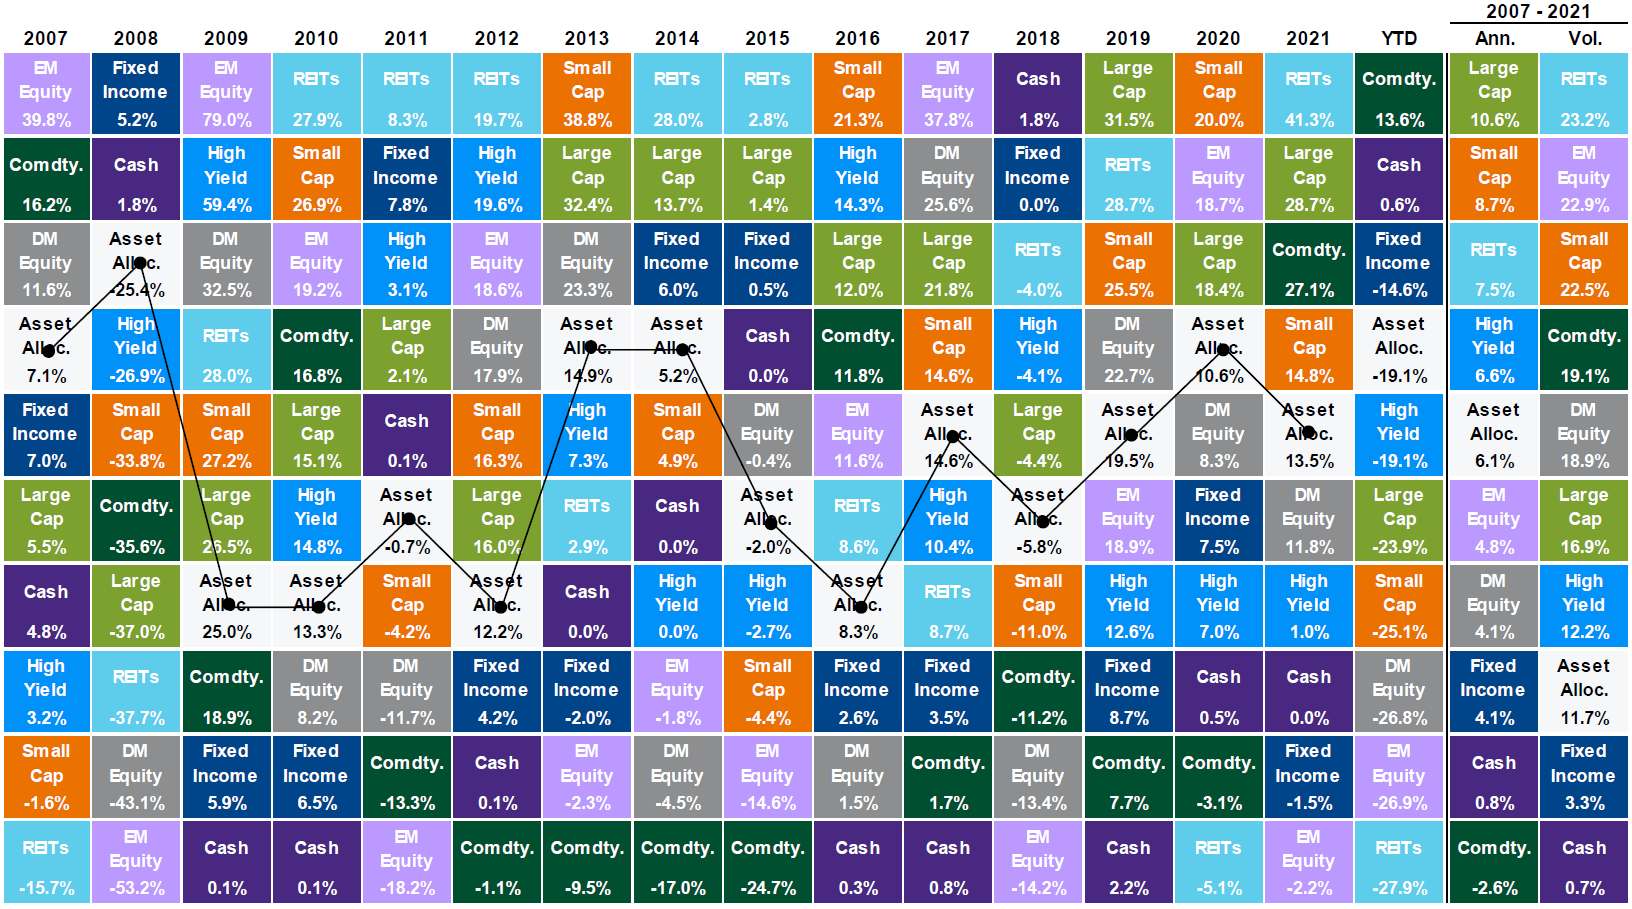
The Callan chart below, also known as a quilt chart, shows the performance of various broad asset classes each year back to 2007. It also includes an Asset Allocation portfolio (white boxes) as a combination of all the asset classes. Key points:
- All asset classes experience volatility in returns. Notice REITs over the past several years. Top performer in 2019, worst in 2020, top again in 2021 and worst again in 2022 YTD. Selling REITs after a period of underperformance would not have worked well.
- However, asset classes don’t exhibit the same cyclicality. Each asset class has a certain period in which it does well and another in which it does poorly. For example, in the last four years, whenever REITs have done poorly, Fixed Income has performed relatively well, and vice versa.
- As opposed to trying to time the market, staying balanced and diversified helps to smooth out returns. Being allocated to a variety of asset classes lowers the overall portfolio volatility and offers a smoother ride, particularly during periods of market stress. Looking at the aggregated data in the right two columns, we see that being allocated to a diversified portfolio results in above average returns while maintaining a relatively low level of risk.
Asset Class Returns
 Source: Bloomberg, FactSet, MSCI, NAREIT, Russell, Standard & Poor’s, J.P. Morgan Asset Management.
Large cap: S&P 500, Small cap: Russell 2000, EM Equity: MSCI EME, DM Equity: MSCI EAFE, Comdty: Bloomberg Commodity Index, High Yield: Bloomberg Global HY Index, Fixed Income: Bloomberg US Aggregate, REITs: NAREIT Equity REIT Index, Cash: Bloomberg 1-3m Treasury. The “Asset Allocation” portfolio assumes the following weights: 25% in the S&P 500, 10% in the Russell 2000, 15% in the MSCI EAFE, 5% in the MSCI EME, 25% in the Bloomberg US Aggregate, 5% in the Bloomberg 1-3m Treasury, 5% in the Bloomberg Global High Yield Index, 5% in the Bloomberg Commodity Index and 5% in the NAREIT Equity REIT Index. Balanced portfolio assumes annual rebalancing. Annualized (Ann.) return and volatility (Vol.) represents period from 12/31/2006 to 12/31/2021. Please see disclosure page at end for index definitions. All data represents total return for stated period. The “Asset Allocation” portfolio is for illustrative purposes only. Past performance is not indicative of future returns. Guide to the Markets – U.S. Data are as of September 30, 2022.
As always, Dynamic recommends staying balanced, diversified and invested. Despite short-term market pullbacks, it’s more important than ever to focus on the long-term, improving the chances for investors to reach their goals.

