
(MarketWatch) All the U.S. stock market seemingly does is set records, so let’s take a look at the world of bonds, where the bulls have been blasting yields lower.
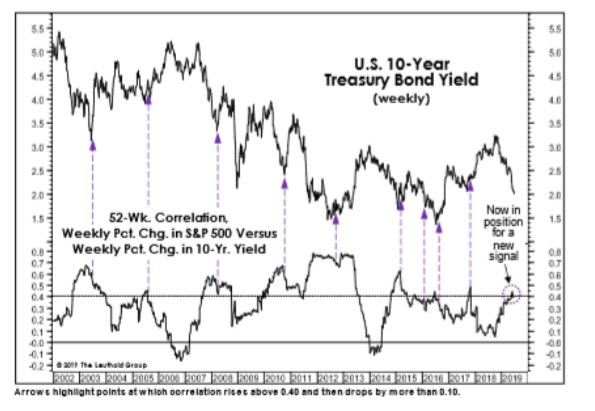
MarketWatch’s call of the day comes from the Leuthold Group, a Minneapolis investment research firm, which tracks the correlation between weekly percentage changes in the S&P 500 and the 10-year Treasury yield. The correlation between the two flipped positive in the late 1990s, perhaps because of the global economy’s bias towards a decrease in the rate of inflation that stems from rapid technological change and globalization in trade.
Right now, the correlation between the two is at what Leuthold calls an “extreme” level, prone for reversal and, according to the analysis, near a top. Those peaks have identified eight of the last nine best times over the last 18 years to sell bonds. Yields have spiked by an average of 45 basis points in the 13 weeks following a correlation sell signal.
But what would a peak in correlation mean for stocks? Apparently little, according to the Leuthold analysis — “the bias has been for somewhat below-average equity returns in the 4-week, 13-week, and 52-week periods following a definitive correlation peak.”
As long as we’re on the topic, DataTrek Research points out the average S&P sector correlations are at 8-month lows, due to market confidence of future dovish Fed policy and that the belief that long-term bond yields will continue to decline. Correlations between U.S. large caps and developed economy non-U.S. equities and emerging market stocks are also falling — which DataTrek attributes to the U.S.-China trade war, and its impact not just on Asia but the big export-oriented eurozone economies.

