
(Reuters) - Inflation has emerged as a primary concern for investors.[1] On balance, arguments for ‘uncomfortably high’ US inflation seem to outnumber those against, at least in the near term.[2] A natural consequence of such a risk is for investors to seek protection against it. Gold is a proven long-term hedge against inflation but its performance in the short term is less convincing. Despite this, our analysis shows gold can be a valuable component of an inflation-hedging basket.
We also show that gold protects purchasing power in the long run against more than just the price of goods and services. In tracking money supply, gold can help investors protect against potentially excessive asset price inflation and currency debasement.
Why inflation is currently a concern
As the global economy and financial markets begin to recover from the COVID-19 pandemic, a chief concern for many investors is the somewhat novel prospect of ‘high’ inflation – particularly in the US where investors have been used to low levels of inflation for more than three decades.
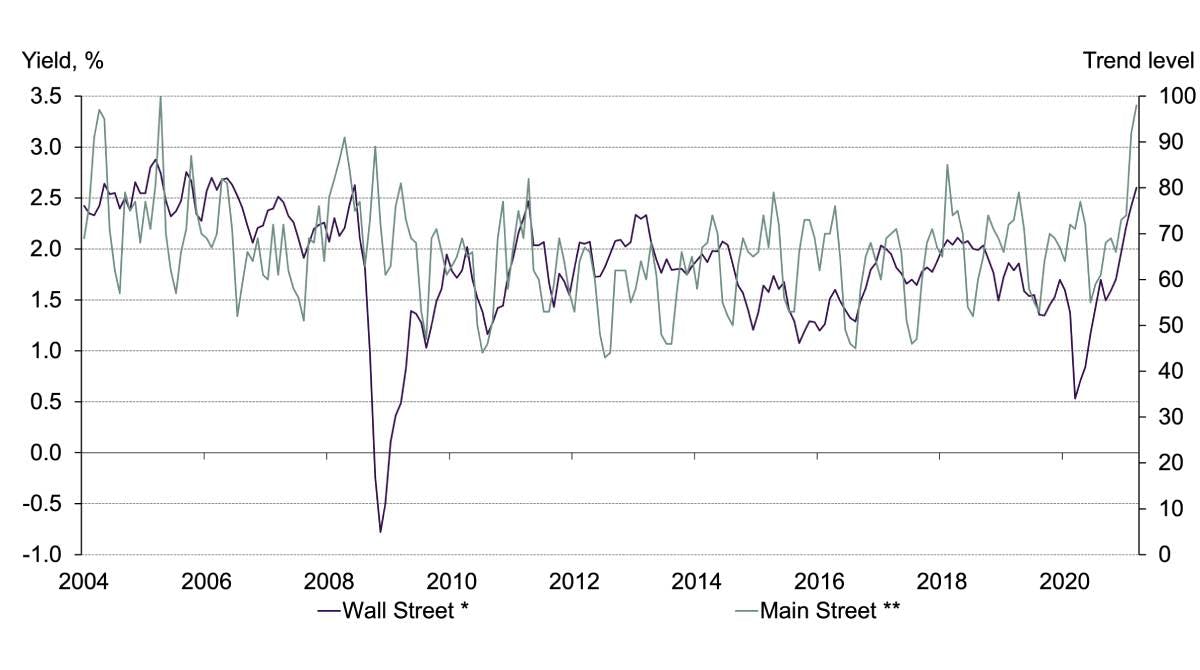
Although both the output gap and unemployment remain high, the quick economic recovery has left many areas of supply tight. Commodity prices are reflecting this, as are shipping rates and business inventory data. In addition, the massive increase in global government debt as well as central bank acceptance - if not promotion[3] - of higher inflation suggest the risks are, on balance, skewed to the upside. Both Main Street and Wall Street have taken notice (Chart 1).
Chart 1: Market expectations and interest in inflation at multi-year highs
US 5-year breakeven yield and Google Trends searches for inflation
Gold and US CPI inflation: a non-linear relationship
The hegemony of the US dollar and US interest rates means that broad conversations on inflation invariably focus on the US consumer price index (CPI).
For all the talk of gold as an inflation hedge, its relationship to changes in the US CPI is surprisingly poor (Chart 2).
Gold returns and CPI changes have a historically weak linear relation
Since 1971, only 16% of the variation in gold prices can be explained by changes in CPI inflation.[4]
While a period from the 1970s to the early 1980s experienced both strong gold returns and extremely high inflation (purple dots, Chart 2), this has not been repeated since, partly because inflation has been much lower and partly because the relationship between gold and the CPI has been weaker.
Chart 2: Gold and the US CPI: weak relationship post- 1970s
Correlation between % y-o-y change in gold US$ and US CPI
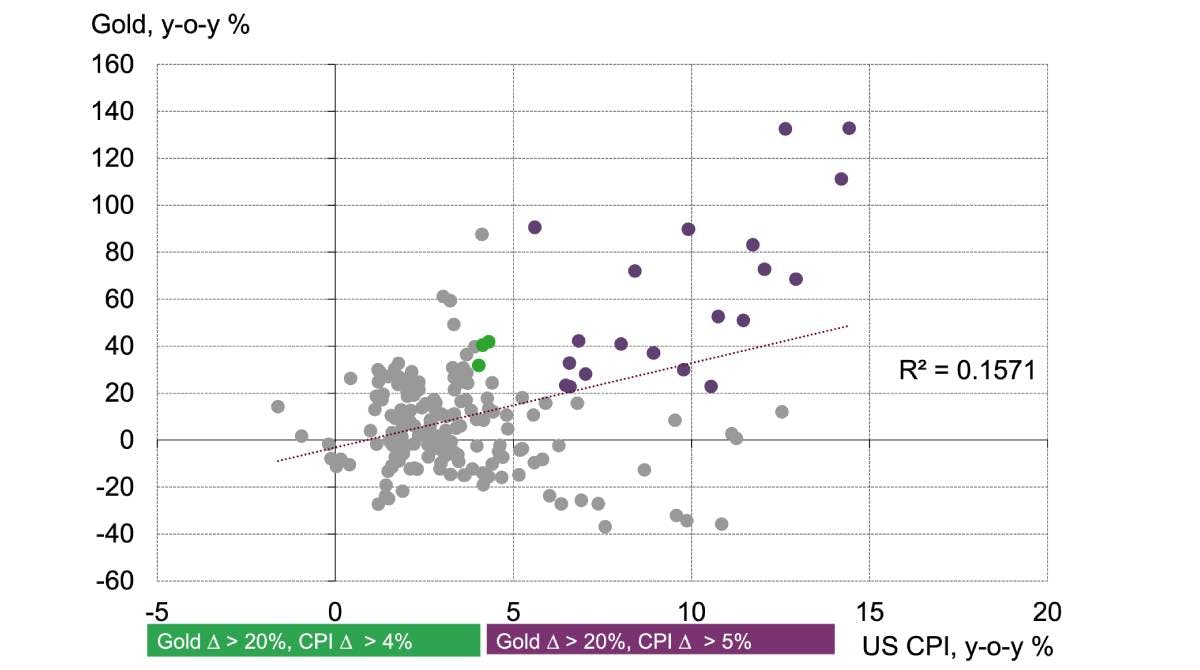
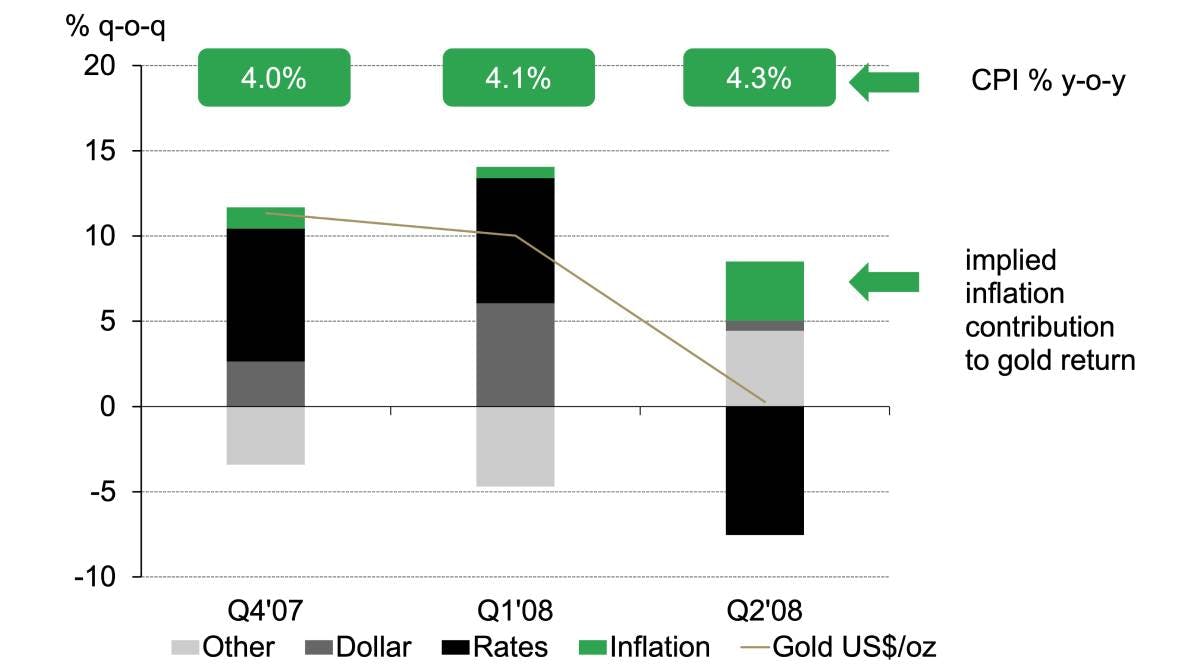
In fact, since the early 1980s the only sustained period of ‘uncomfortably’ high CPI inflation (+4%) amid good gold returns ran from Q4 ’07 to Q2 ’08 during the depth of the Global Financial Crisis (GFC) (green dots, Chart 2).
Although gold returns were good, inflation or inflation expectations appeared not to be prominent drivers – as suggested by our short-term gold returns model (Chart 3).[5]
Chart 3: Recent ‘uncomfortably high’ inflation readings did not appear to drive gold returns
Gold short-term returns model attribution*
This leaves the collection of grey dots in Chart 1, which demonstrates periods of high returns amid lower inflation and, more strikingly, low returns amid high inflation. It is difficult to draw any definitive conclusions here. It may be that we are missing the important expectations aspect of inflation during those periods or that we are not controlling for other variables. Testing for this (see Appendix A), we found some explanatory power in inflation expectations, but even when controlling for the US dollar and bond yields, CPI does a poor job of explaining returns across a 40-year period.
Low gold sensitivity to CPI from a benign environment and access to other hedges
This inconclusive linear relationship does not preclude gold from being used as a hedge. Instead, it merely suggests that US CPI alone is often insufficient to push gold’s price up or down.
Outside of the US we have good evidence that investors buy gold to hedge themselves against pernicious inflation, perhaps more so than in the US.[6]
Gold is not the only hedge against inflation, suggesting that a link should exist between gold’s sensitivity to inflation and investor access to other forms of inflation protection – such as central bank policy or access to financial or real assets. In developed markets such products are increasingly within investors’ reach.
Another reason for a lower sensitivity is the benign inflationary environment experienced over the last 40 years. There has not been a sustained period of inflation for four decades and this may suggest some of our sensitivity has diminished. But lower sensitivity should not lead to complacency. It is crucial to have a well-planned inflation strategy in place and gold should be a component of this strategy.
Gold as part of an inflation-protected portfolio
As we have shown in much of our research, gold’s strongest attribute is its contribution to a portfolio even though, with regard to inflation, gold appears somewhat of a blunt tool. Yet when added to a selection of assets, its performance begins to shine.
A piece written almost a decade ago by Ruff and Childers (2011) still resonates on this front. It argues that there are three key factors that determine the effectiveness of an inflation hedge: sensitivity, reliability and cost.[7] We would add liquidity and diversification as additional important considerations. Gold’s sensitivity and reliability may be trumped by direct hedges such as Treasury Inflation Protected Securities (TIPS) – directly linked to the CPI – and energy commodities, which are key inputs into the CPI. But gold prospers in countering the cyclicality of such commodities and the relative illiquidity of TIPS.[8]
Ruff and Childers looked at the performance of a selection of hedges from 1965 to 2009. They found that although gold had among the highest sensitivity to inflation – much of which would have taken place in the 1970s – it had lower reliability and the worst cost.[9] Their analysis took all years into account, whether inflationary or not.
To complement and update the analysis, we took a similar approach in creating a scorecard for various inflation-hedge contenders including gold, but limited our analysis to periods that could have been deemed ‘inflationary’. The lack of ‘high’ inflation during the period and the small sample size means that our analysis should only be taken as indicative.
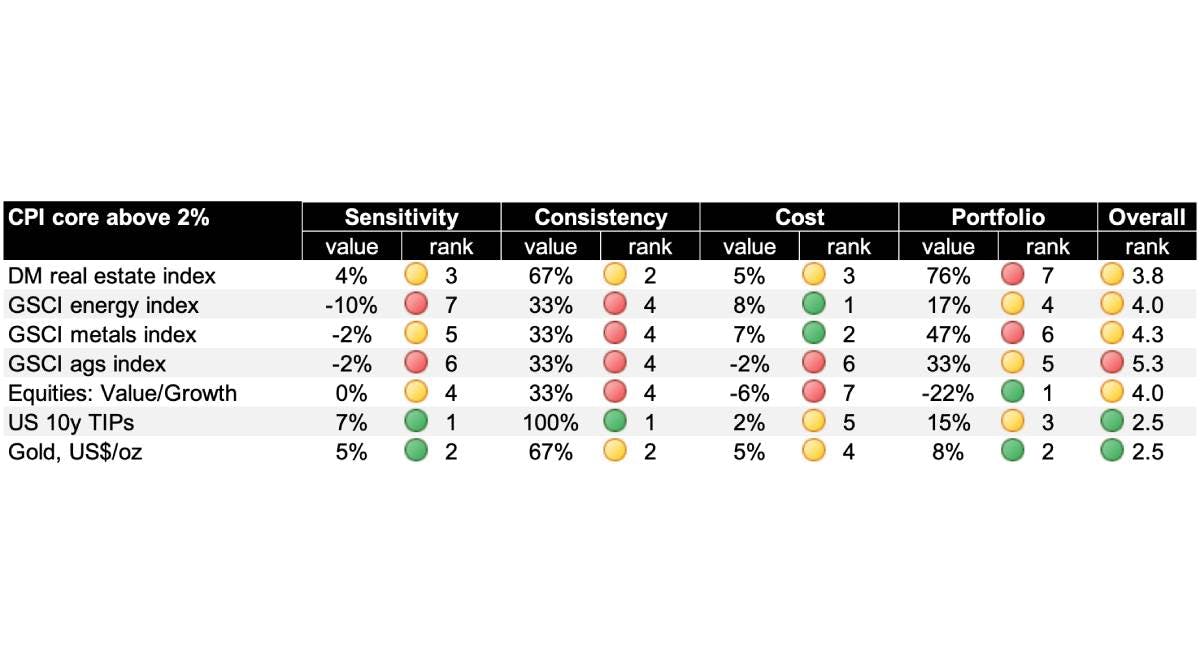
We first defined inflation phases in two ways that could conceivably impact an investment portfolio: 1) a sustained[10] rise in the CPI, which could undermine both a bond portfolio and a growth-stock oriented portfolio, and 2) a sustained period of inflation above 2%, which could potentially un-anchor expectations and undermine monetary policy.[11]
We then examined how assets performed during these phases by focusing on four metrics: sensitivity, reflecting the period’s annualised performance; consistency, which tracked how often assets posted a positive return; cost, which is the return from these assets outside of the inflationary phases; and, finally, portfolio impact which details the correlation of these assets to a 60/40 equity-bond portfolio across the full window of observations.
Chart 9 and Chart 10 in Appendix B detail the various phases selected. The assets chosen are widely recognised as inflation hedges given they are ‘real’ assets and their values don’t automatically erode via the discounting that affects most financial assets nor do they theoretically quickly reprice if inflation rises as in the case of REITs and TIPS. But we also introduce a simple financial asset strategy: long-value and short-growth stocks, to bring both higher potential inflation sensitivity and diversification attributes.[12]
The results show that gold ranks high on these metrics and in this environment
Our results in Table 1 and Table 2 show that Real Estate Investment Trusts (REITs) and TIPS are the most consistent hedges against inflation and have provided the highest average returns. Gold ranks third in rising environments and second in persistently high environments. While gold is not top in all individual categories, it does quite well collectively. Averaging across all metrics, gold ranks consistently well either as first or joint second, depending on which inflation environment we select.
Table 1: Inflation basket asset performance during sustained periods of rising CPI
Comparing seven assets against four inflation basket attributes
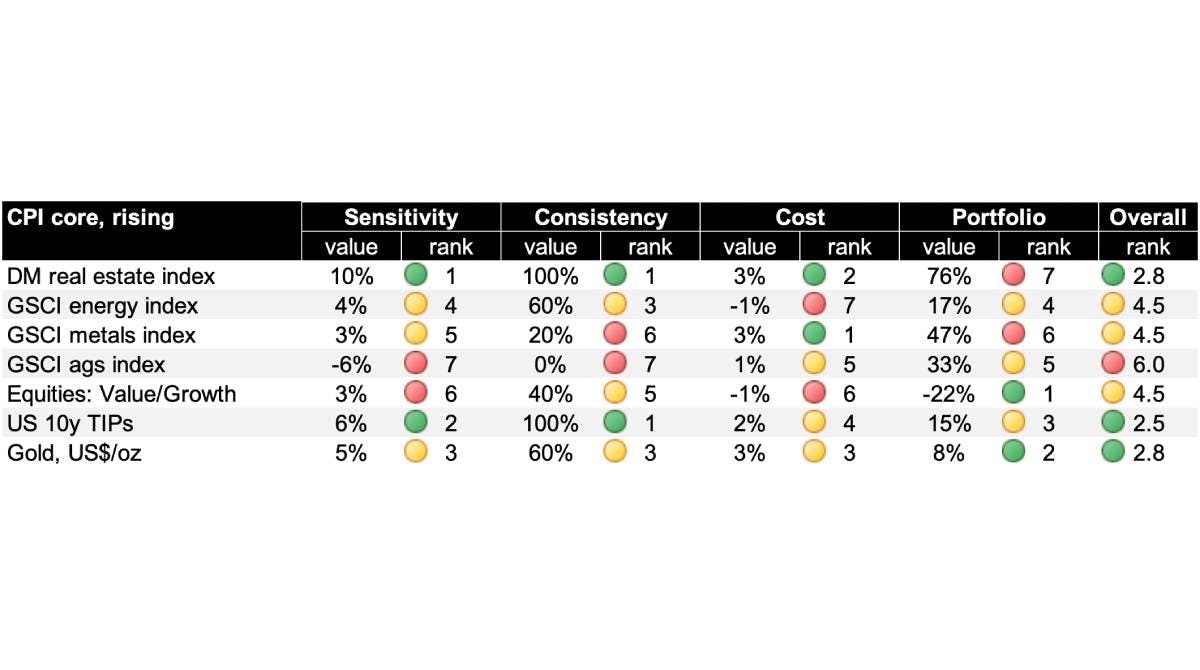
Table 2: Inflation basket asset performance during sustained periods of CPI above the 2% target
Comparing seven assets against four inflation basket attributes
Gold’s long-run link to money supply
Turning to the long-run relationship between gold and inflation, we can draw similar conclusionsHaving covered the short-run relationship between gold and inflation and established its inconsistency over the last 50 years, we turn to the long-run relationship.
What we find, borrowing from academic work published by Lucey, Sharma and Vigne (2016)[13] , as well as supplementing with our own, is that gold’s relationship with CPI has indeed been inconsistent and time-varying and, as a result, insignificant on the whole since 1971.
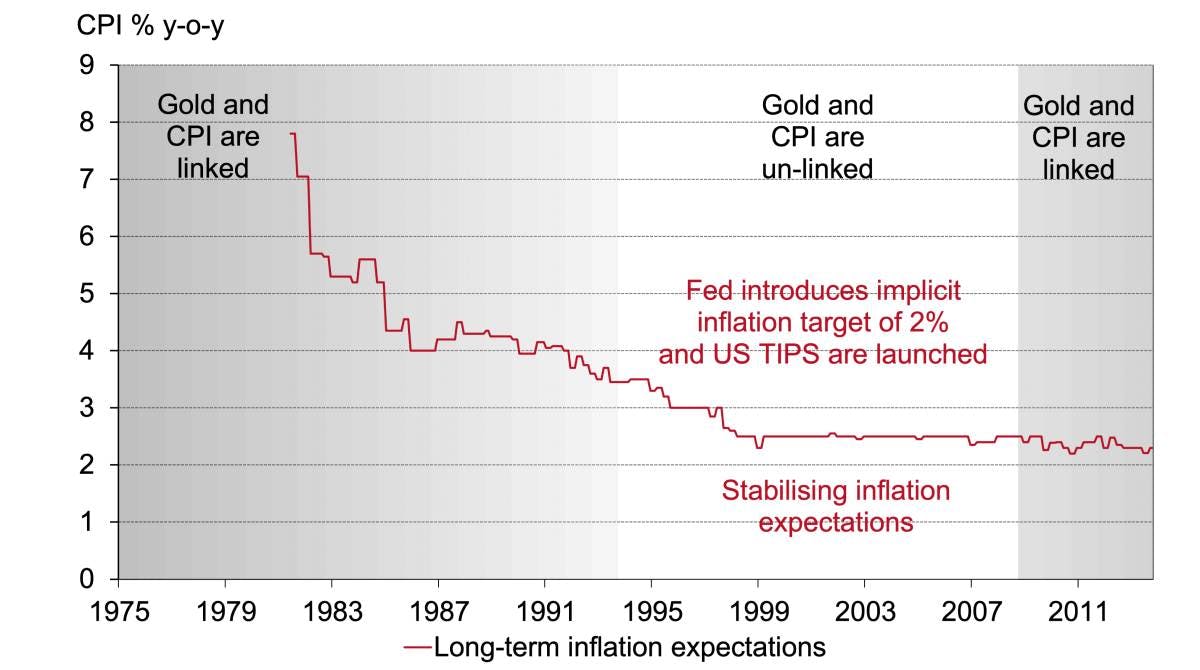
The mid 1990s saw a pivotal shift in the Federal Reserve’s policy on inflation and heralded the launch of inflation-linked bonds Chart 4 shows how the mid-1990s were pivotal to a change in both monetary policy and inflation expectations. In 1995, then Chairman of the US Federal Reserve (Fed), Alan Greenspan, ushered in a new era of inflation policy with an implicit 2% target[14] to ensure full employment and price stability. In Jan 1997, TIPS notes were auctioned for the first time. Around the same time long-term inflation expectations appeared to stabilise.[15] As this was happening we observed another important development: a break in the long-run relationship between gold and the US CPI that would, according to analysis by Lucey et al, last until the 2008 GFC. The anchoring of longer-term inflation expectations during this period may have gone hand-in-hand with the reduced need for an inflation hedge.
Chart 4: The relationship between gold and the CPI became insignificant in the 1990s as monetary policy shifted and TIPS were launched
Significance of the relationship between gold and the US CPI, 10-year US inflation expectations, and Fed policy shift (grey area)
A broader metric than CPI may be more adequate to measure true inflation
On the other hand, if we use a broader measure than CPI the evidence suggests a stronger and more consistent relationship. This has two important implications: gold is a global asset and a hedge against not just the price of goods and services but also the erosion of purchasing power in general – be that against property, collectibles or financial assets that are excluded from CPI indices. It is also a hedge against the debasement of a currency should the value of that currency be slowly eaten away as supply is increased. In addition, it reflects that a sizeable proportion of demand is consumer-driven and impacts prices in the long run. Money supply is closely linked to nominal GPD growth and may reflect this important consumption dynamic as well as the inflation dynamic.
More direct CPI hedges, such as TIPS and commodities, can protect investors in terms of their future spending on goods and services, but not necessarily against the erosion of purchasing power or the potential for excessive asset reflation following a surge in money supply.
Where did all the money go?
One source of confusion over the last decade has been the lack of inflation via CPI despite the enormous increases in central bank balance sheets.[16] This applies to Japan, China and the Eurozone as well as the US. The transmission mechanism to feed increased money supply to household spending appeared broken. Instead, it has been argued that much of this money has served to inflate assets instead – by keeping interest rates and therefore borrowing costs low which has by extension supported risk assets. In addition, perceived central bank protection against market instability has arguably been viewed as a put option on risk assets – whereby central banks are willing to step in if prices fall too far.[17] Equally there are direct impacts on risk assets via central authority purchasing of financial assets.[18]
But the impact is now showing signs of filtering through to CPI, with M2[19] in particular having been jolted into life by recent capital injections, something we did not witness during the GFC (Chart 5).
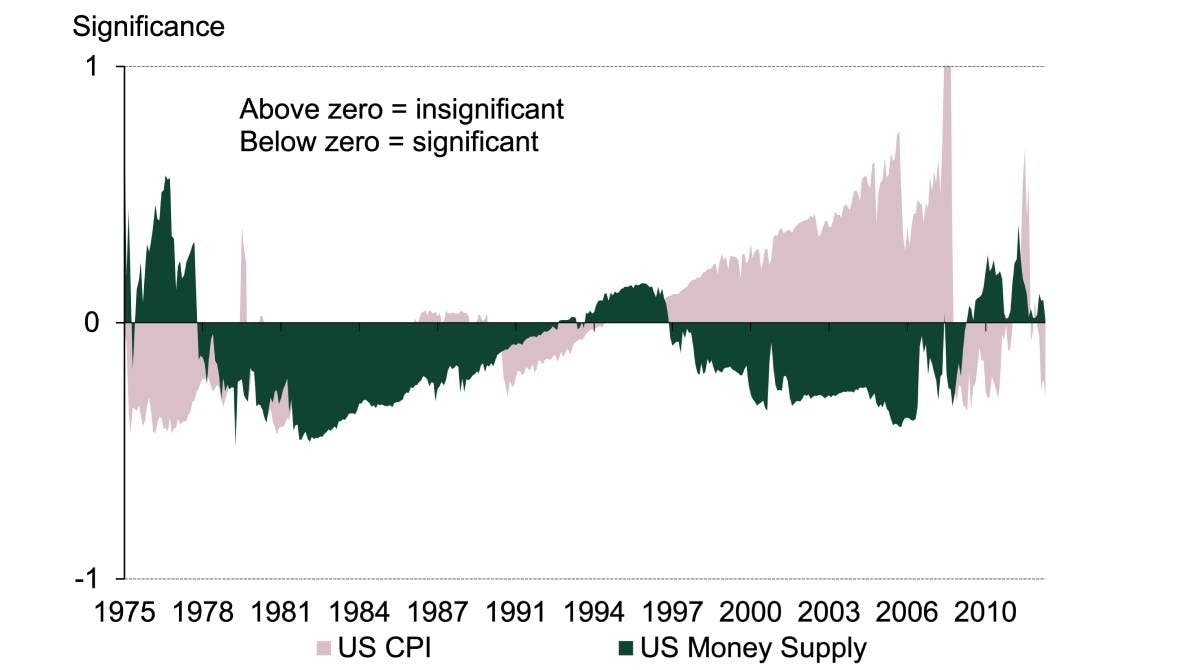
In addition to CPI, Lucey et al looked at gold’s relationship to money supply, arguing that an increase in the amount of money positively impacted both consumer and investor demand for gold. In contrast to the weak overall and time-varying relationship between gold and CPI, the authors found a strong and consistent relationship to money supply across the sample (Chart 6).
Chart 5: US M2 increase in 2020 threatens inflation more than it did in 2009
US MZM[20] and M2 money supply indices
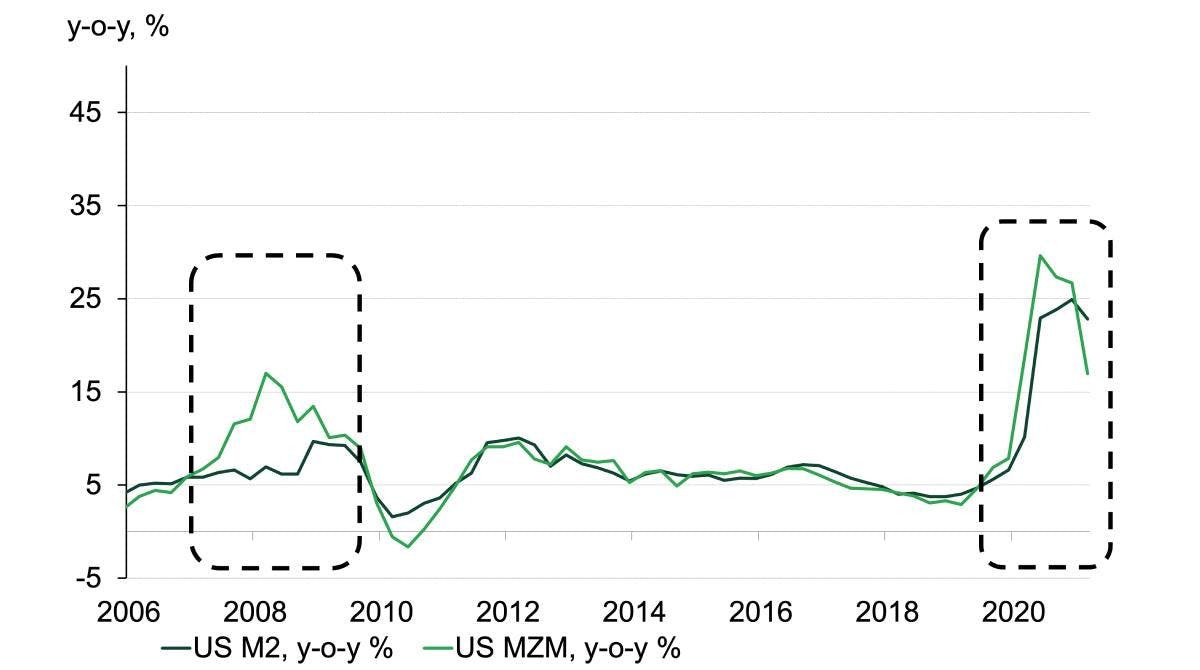
Chart 6: Gold’s cointegration with CPI varies but is stable with money supply
Significance of cointegrating relationship between gold and CPI as well as gold and money supply
Our analysis shows a strong link between gold and US M2
Our own analysis using a complementary technique of cointegration (see Appendix C for definition) to Lucey et al and extending the window to 2020 supports the findings that the gold price is not significantly cointegrated with US CPI over the full window from 1971 to 2020. Similar to Lucey et al, we find evidence of cointegration between the gold price and money supply.
We tested for cointegration between the US CPI, US M2, global M2 and a demand-weighted index of money supply, CPI and PPI. Our rationale was to capture both the global nature of gold and its variety of uses, and to demonstrate that money supply can indeed increase both investment demand and consumption demand for gold – where investment reflects an increased risk of inflation and consumption reflects money supply’s link to economic expansion. We apply demand-derived weights to money supply, CPI and PPI.
Chart 7: Significance of the gold and inflation-measure relationship between 1971 and 2020
p-value for test statistic from cointegration tests
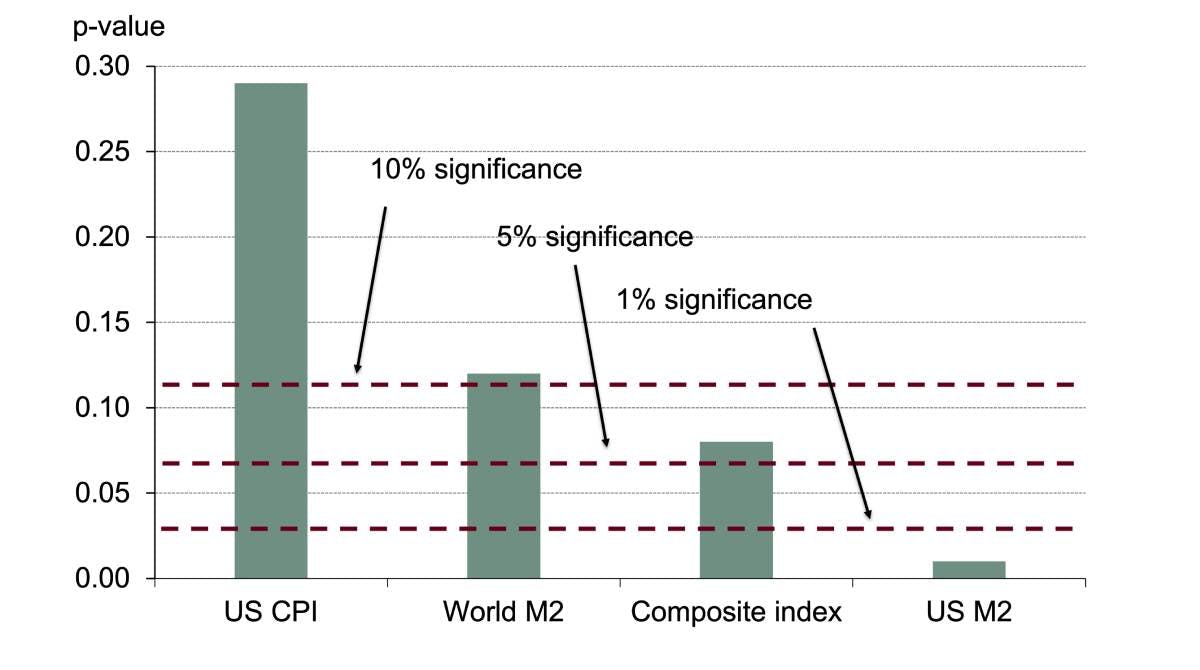
Full results are presented in Table 4 in Appendix C. Spanning the full sample from 1971 to 2020, we found that gold and the US CPI showed no evidence of cointegration to support the findings of Lucey et al. However, we did find strong evidence of cointegration between gold and US M2 (Chart 7).
The results for our composite index are not sufficiently conclusive but they encourage further research to find a mix that appropriately captures the global nature of gold demand. While investment is the most important driver of oscillations in gold prices, especially in the short term, the value of consumer demand is the rod for gold’s back and can act as a ballast to investment at times.
One of the more important takeaways here runs counter to the commonly perceived notion that gold is simply a CPI inflation hedge in the long run and its price will oscillate around this trend, much like other commodities, with a zero real return.[21]
Chart 8: Gold, money supply and CPI
Gold US$/oz, US M2, US CPI indexed: Q1 1971 = 100
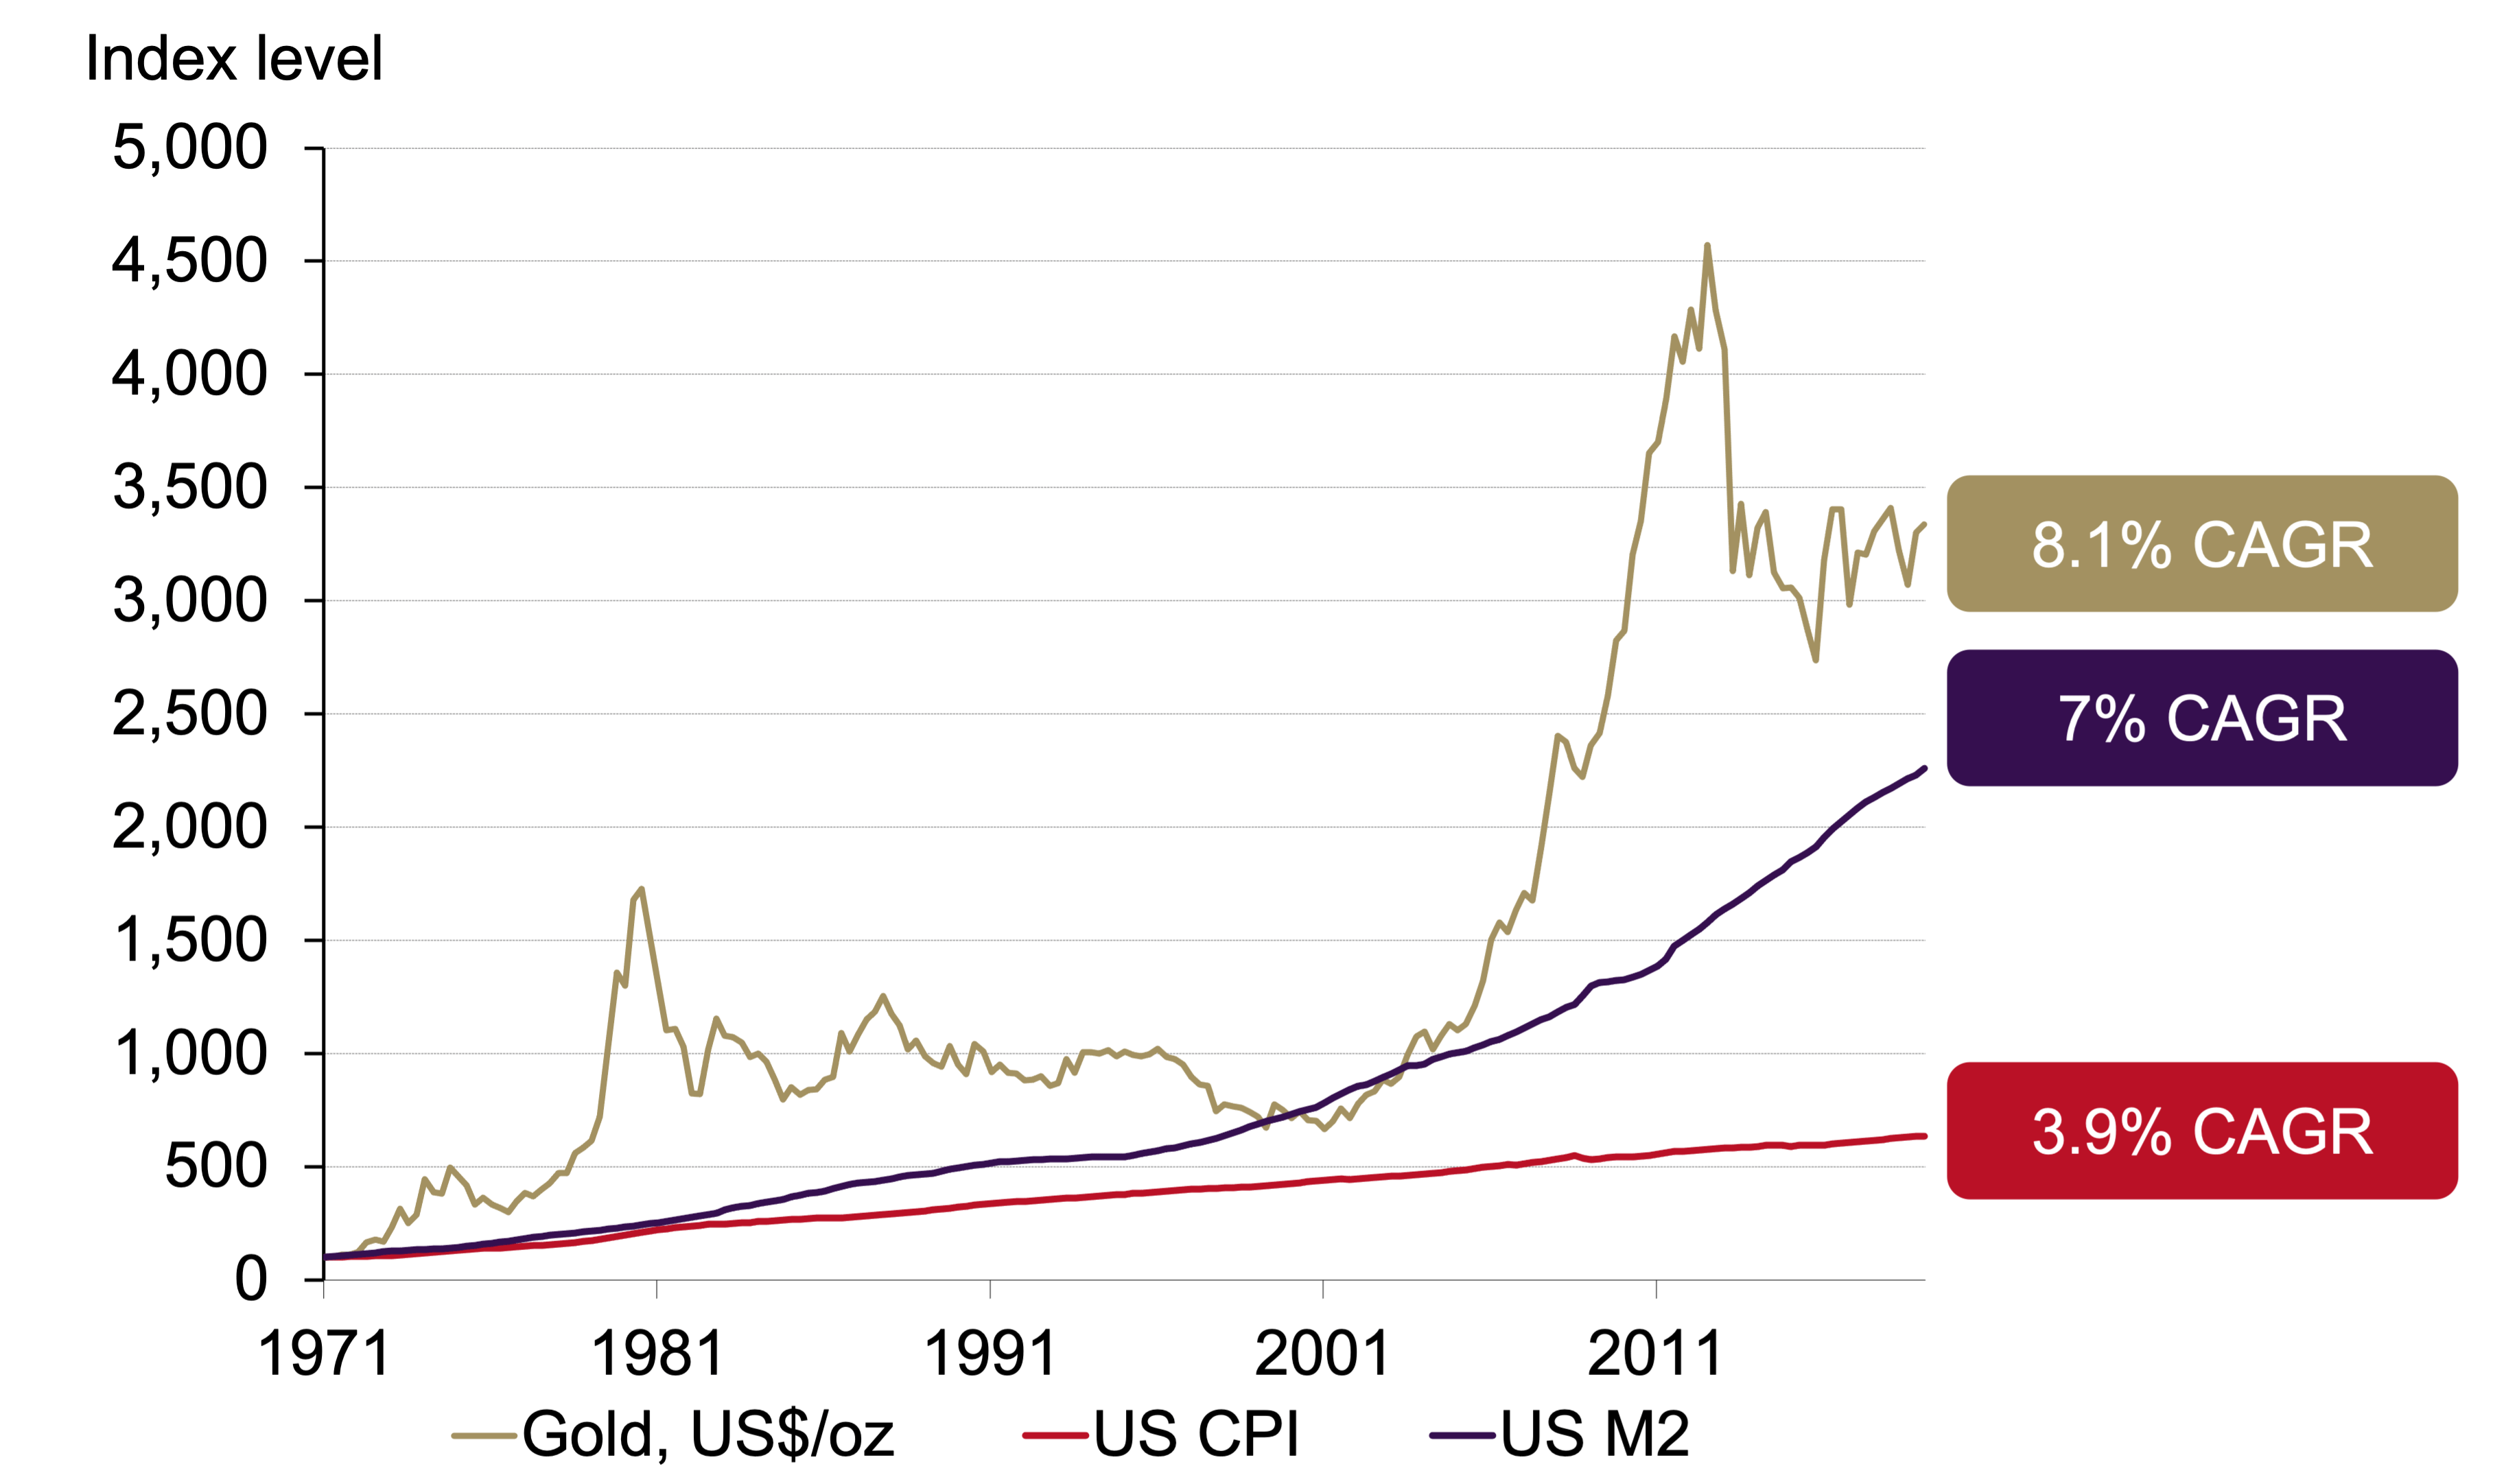
While there is more work to be done, gold’s financial asset status and its value as a means of saving, ties it more closely to economic growth and money supply growth in the long run than just CPI, fomenting an argument that its long-run return should be positive in real terms. Chart 8 details the compounded returns of gold, CPI and M2. From a long-run return perspective and a valuation perspective, we believe M2 better reflects gold’s ‘inflation’ credentials as well as its ties to economic growth and risk not reflected by the CPI.
So, what might we expect this long-term return to be? Because there are various summary measures of return and start dates matter, we resort to mid points. Gold’s return since Q1 1971 ranges between 8.1% (Compounded annualised growth rate - CAGR) and 10.3% (annual average); this compares to c.3.9% for CPI (it is similar using either measure) during the same period. However, this may be an overly favourable assumption for gold. If we penalise gold and start at the previous peak of the gold price in Q3 1980, we get between 2.6% and 3.8% CAGR for gold and 2.9% CAGR for CPI. So, the truth probably lies somewhere in the middle – if we average the starting points and the methods of calculation, we see a range of 2.0% to 3.6% real return. This is consistent with money supply. It is consistent with the 30-year return we forecast through our Qaurum model and it is consistent with the notion of gold as an investment and consumption asset which grows as wealth grows.
Focus 1: What Qaurum can tell us about gold and inflation in 2021 and beyond
As we look to this year and the next, we can use our Qaurum model to get an idea of where gold might go and what will help it get there. The baseline scenario provided to us by Oxford Economics sees gold return an implied 14.4% in 2021. The attribution of the model tells us that 4% of this return is the result of a rise in global CPI (to 3.2% from 2.8%), driving bar and coin demand higher. In the higher inflation scenario rates offset inflation and world CPI climbs to 4%, contributing 7% to the rise in the gold price. However, aggressive monetary policy and steeper rises in bond yields – which prompt Exchange-traded Funds (ETFs) and Over-the-counter (OTC) investors to demand less gold – offset the gains, and in this scenario the return is 10.7% in 2021.
Conclusion
Inflation has supplanted the global pandemic as a primary risk. But the jury is out over whether this inflationary episode materialises, is transient or pervasive.
If it is more than just a short-lived event, an inflation-protected portfolio should include gold for the benefits it brings. Our Qaurum model can offer some guidance on the implied impact of inflation on both demand, supply and price (See Focus 1).
In the long term, gold serves as a strong strategic component in many portfolios, not only for its diversification benefits but also for its returns. The relationship gold is shown to have with money supply demonstrates, perhaps, that the strong returns we have experienced since 1971 are not aberrant. Gold’s ability to protect against more than increases in the general price level suggests that its long-term real returns should be positive – something current long-term portfolios may struggle to achieve.
Appendices
Appendix A
We analysed the impact of inflation and inflation expectations between 1982 and 2020 by regressing changes in the gold price on changes in inflation or inflation expectations as well as changes in a broad US dollar index and the 10-year US Treasury yield. Our sample was constrained by the availability of survey data.
Table 3: Gold’ sensitivity to changes in inflation and inflation expectations
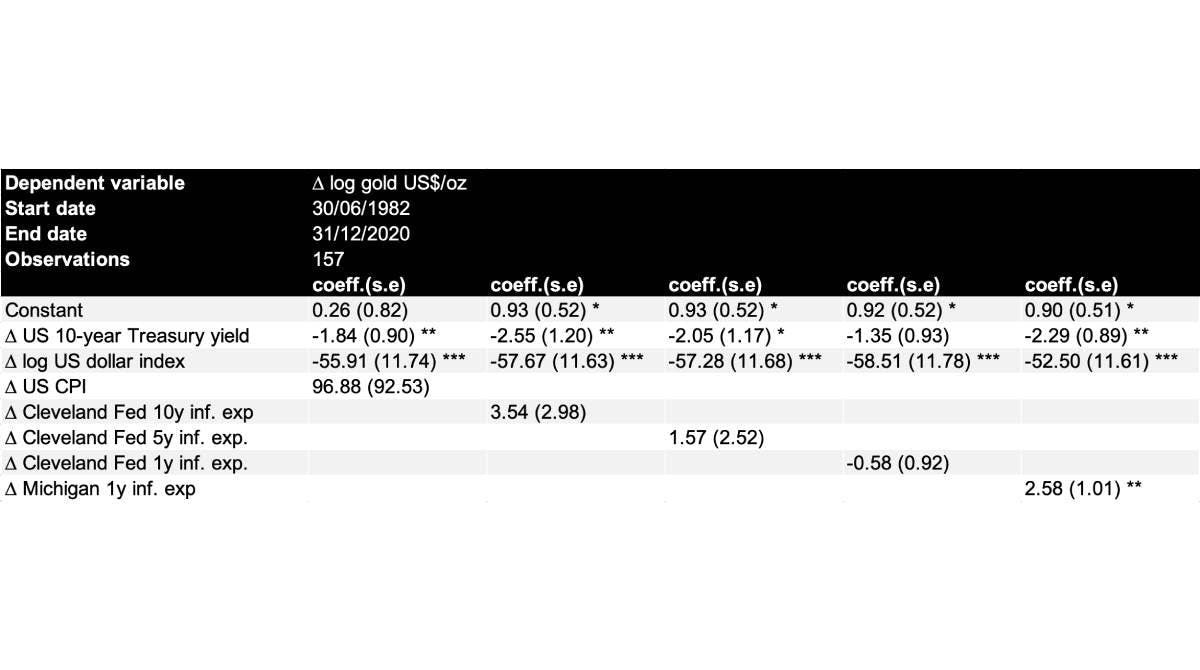
Regression of monthly gold returns on various measures of inflation and inflation expectations, a US dollar index and the US 10-year Treasury yieldSource: Each column shows the regression coefficients for included variables with standard errors in parentheses and significance levels as follows: 1% ***, 5% **, 10% *.
Using five different inflation surveys and controlling for changes in the US broad trade-weighted dollar index and 10-year Treasury yields – two key drivers of investment demand – we found no significant evidence of a link between inflation factors and gold with none of the explanatory inflation variables significant at even a 10% significance level, except for one-year consumer expectations from the Michigan Fed (Table 3). The results highlight what could be an inconsistency between the expectations of consumers and those of professional investors.
Appendix B
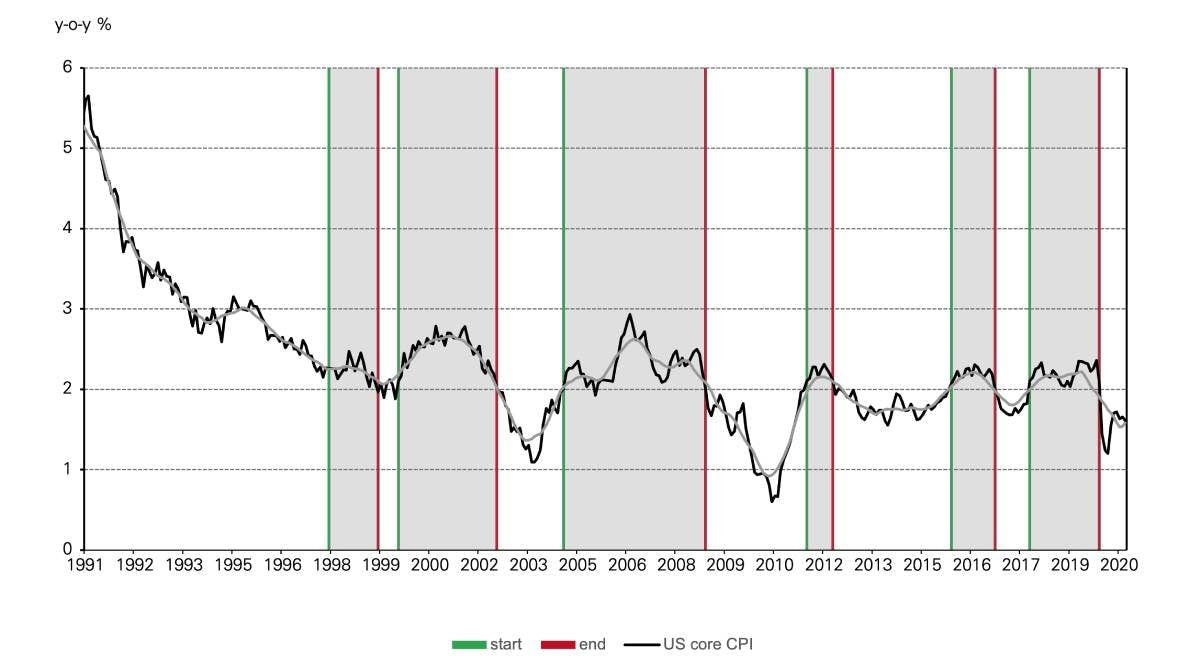
In analysing gold’s contribution to an inflation-hedge basket, we first needed to define our periods of inflation. Chart 9 highlights periods of sustained rises in inflation. We defined sustained as lasting more than 10 months and including at least three quarters. Chart 10 highlights periods of sustained core inflation above the Fed’s implicit and after 2012, explicit 2% target. Again, we use 10-months as a cut-off for the duration of a period.
Chart 9: Inflation: sustained periods of rising core CPI
US core CPI and centred 12-month moving average
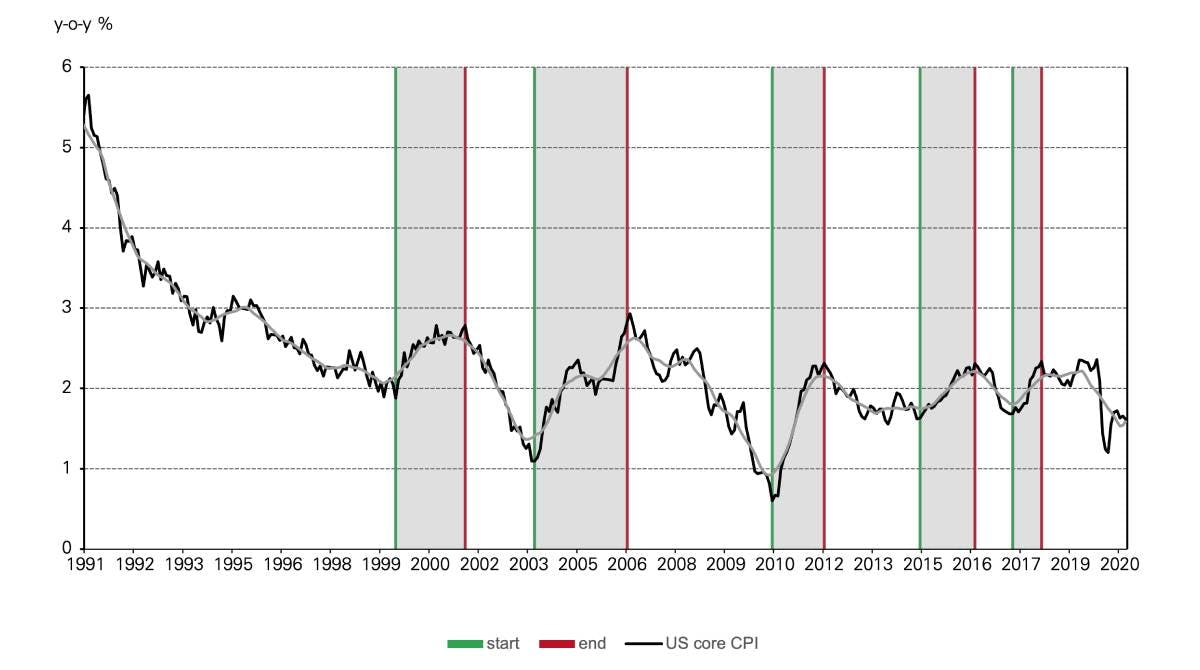
Chart 10: Inflation: sustained periods of core CPI above 2% ‘target’ (see footnote 11)
US core CPI and centred 12-month moving average
Appendix C
Drawing on analysis conducted by Lucey et al, we undertake a complementary approach to testing for the existence of a cointegrating relationship between two series. This involves determining whether two series statistically move together and is calculated by establishing whether the difference between the two is stationary (mean-reverts over time). Consider financial assets that have an arbitrage relationship such as bonds of different maturities. If one deviates too much from the other, then forces of arbitrage will begin to merge them together again. Such series are often strongly cointegrated.
We employed the Engle Granger[22] approach to test for cointegration, as this works well in a bivariate setting (two variables) as well as when the direction of causation is more evident. In our case we are confident that inflation and/or money supply impacts gold, but not the other way around.
This test first needs to determine that the series are non-stationary on their own, a condition of their differences potentially being stationary. Then follows a test of whether the errors between the series are stationary. The null hypothesis is that they are not. We use an augmented Dickey-Fuller test to establish if we can reject that null hypothesis at a pre-determined level of significance, typically 5%. In Chart 7 we emphasised the three commonly used levels of significance: 10%, 5% and 1%.
We tested for cointegration between gold and four separate measures of inflation and money supply: US CPI, US M2, World M2 and a composite index.
Rather than MZM, which is now discontinued, or other narrower measures such as M1 or base money, we tested M2 as a broad measure reflecting not only the creation of money but also the creation of credit. As such it also holds a stronger link to nominal economic growth.[23]
For world M2, we aggregated the dollar value of M2 measures from a universe of countries covered in the Oxford Economics database sourced via Refinitiv Datastream. Their series start in 1980 so to backfill data to 1971, available series for the largest contributors in 1980 were sourced to provide a proxy for global M2 back to 1971. These countries were the United States, Japan, Germany, France, Italy, Canada, Australia and the Netherlands.
Finally, we constructed an index of money supply, CPI and PPI (producer price index) based on Lucey et al.
This final index reflected the various perceived inflation sensitivities within gold demand. As raised by Lucey et al, demand for gold can be broadly divided into three groups: investment, consumption and industrial; different measures of inflation will be relevant to each. Investors are likely most concerned about changes in money supply as these can translate into erosion of purchasing power, an increase in debt through fiscal imprudence, monetary-driven inflation, or the potential for asset bubbles. CPI is relevant to consumers and PPI to industrial users, although PPI was ultimately a very small component of the index.
This index was constructed using money supply (US M2), CPI (US, Eurozone, China and India) in equal weights and PPI (US, China, India and Japan) in equal weights. These three unweighted series were then combined for each year from 1971 to 2020 by weighting each one by their corresponding share of demand for that year.
For example, we proxied the money supply-sensitive share of demand by adding together bar and coin, ETFs, central banks and OTC investment and stock flows. Jewellery represented CPI and Technology represented PPI. In 2019, these weights amounted to 49%, 44% and 7% respectively. To construct the index value for 2019, we multiplied the change in M2 by 49%, change in our CPI composite by 44% and the change in the PPI composite by 7% to arrive at an index change of 3.6%.
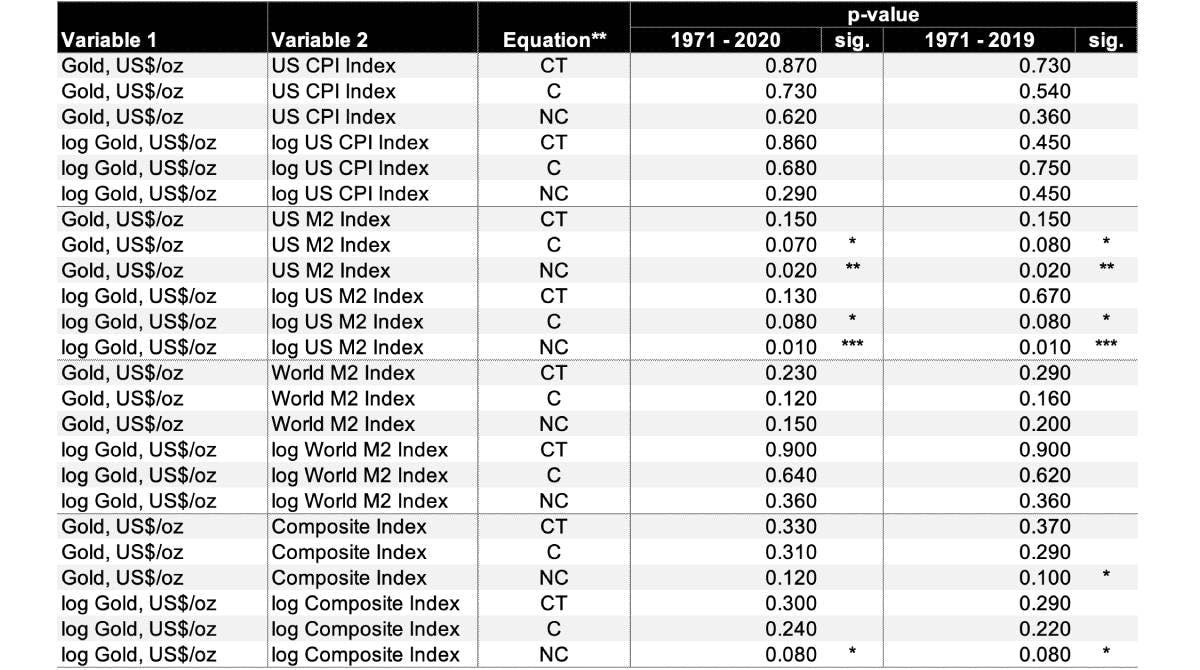
Table 4 details the results for unit-root tests on the cointegrating regression errors (informally: testing for stationarity in the differences between the series). We omit the individual test results for unit roots, suffice to say that all series were I(1) to 2019 but appeared to be I(2) when incorporating 2020, reflecting last year’s surge in money supply. For completeness we tested all equations in levels and logs and to 2019 and 2020 respectively.
The Equation column details whether the equation had a constant and trend (CT), just a constant (C) or no constant (NC). Any of these showing significance suggests a cointegrating relationship as a trend or a constant (intercept) can be removed by de-trending or de-meaning.
Our results show a high level of significance between gold in US$/oz and US M2, particularly in logs. There is some evidence of a relationship between gold and our composite index.
Table 4: Engle Granger cointegration results between gold US$/oz and four measures of inflation/money supply
p-value (significance) from augmented Dickey Fuller test on the residuals from the cointegrating regressions
Sources:
[1] BOFA global fund managers’ survey results.[1] BOFA global fund managers’ survey results.
[2] There is no official definition of ‘high’ inflation. With the Federal Reserve (Fed) accepting 2.4% for 2021, a higher rate or a longer period than this might justifiably be termed uncomfortable as it questions the Fed’s ability or willingness to curtail inflation – and potentially the risk of expectations becoming un-anchored.
[3] Federal Reserve press release, 17 March 2021.“The [FOMC] Committee will aim to achieve inflation moderately above 2% for some time”.
[4] This figure is 5% if we measure % q-o-q changes.
[5] One explanation for this is that gold’s sensitivity to inflation is non-linear and/or time varying. Our simple model assumes a static relationship.
[6] Global Retail Insights: India’s gold market: evolution and innovation | World Gold Council.
[7] Ruff, J, Childers, V. Fighting the Next Battle: Redefining the inflation-protected portfolio. Journal of Portfolio Management. Spring 2011. Vol 37, no. 3.
[8] SIFMA reported 2020 average volume for inflation-linked securities to be US$19.4bn/day vs gold averaging US$182.7bn/day.
[9] Their measure of cost included both the opportunity cost and the potential tax liability of an asset. No doubt the weak gold environment in the 1980s would have contributed to the lower overall holding period return.
[10] All but one of these periods lasted well in excess of one calendar year. Details of the selected periods is given in Appendix B.
[11] Since the mid-1990s and after 2012, 2% has been an implicit and explicit target, respectively, for price stability and full employment by the Federal Reserve (as well as other central banks). The Fed’s Inflation Target. Why 2%?
[12] Value stocks generally enjoy more immediate cash flows and are thus less sensitive to inflation. Growth stocks, whose cash flows are further out in the future, are more sensitive to inflation. By using a long/short strategy an investor also reduces the exposure to the market itself and thus the strategy should be less correlated to the overall portfolio.
[13] Lucey, B.M., Sharma, S.S., Vigne, S.A., Gold and inflation(s) - A time-varying relationship, Economic Modelling, 67, 2016, 88 – 101.
[14] Bullard,2018, “What is the best strategy for extending the U.S. economy’s expansion”, Goodfriend, 2004, “Inflation-targeting in the United States”.
[15] Using Survey of Professional Forecasters 10-year inflation expectations from 1991 onwards and Livingston 10-year inflation expectations prior to that.
[16] Yardeni: Total Major Central Bank Assets.
[17] Balatti, Mirco and Brooks, Chris and Clements, Michael P. and Kappou, Konstantina, Did Quantitative Easing Only Inflate Stock Prices? Macroeconomic Evidence from the US and UK (September 13, 2016). Available at SSRN: ssrn.com/abstract=2838128 or here
[18] How do Central Banks Invest?
[19] M2 is a broad measure of money stock including M1 (Currency and coins, checkable deposits and travellers’ cheques) plus savings deposits, small time deposits and shares in retail money market mutual funds.
[20] Similar to M2 but excludes small time deposits and includes institutional money market funds (MZM is now discontinued)
[21] Ghosh, D., Levin, E.J., Macmillan, P. and Wright, R.E. (2004), "Gold as an Inflation Hedge?" Studies in Economics and Finance, Vol. 22 No. 1, pp. 1-25.

